
3.9 Global CO2 levels and Antarctic temperatures
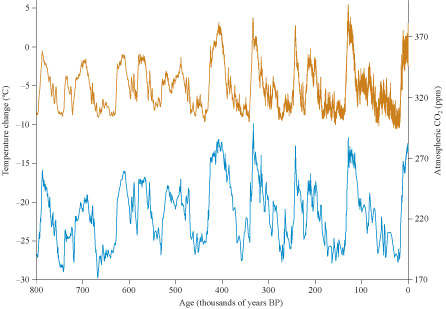
Figure 18 shows that over the last nine glacial cycles, the global CO2 and Antarctic temperature appear to be positively and very closely correlated, showing the same patterns of change.
Activity 9 Temperature and CO2 values
- a.According to Figure 18, what were the typical CO2 levels during the extreme low-temperature periods (ice ages) and at the height of the warmer interglacials?
- b.How does the value of the atmospheric CO2 concentration for 2016 (see Figure 17) compare with that in the interglacials of the previous nine cycles of the EPICA Dome C ice core?
Answer
- a.In an ice age, when the temperature is low, the CO2 is also low, typically 180–200 ppm. When the temperature is highest, in the interglacials, the CO2 is also high, at about 280 ppm for the most recent four interglacials and slightly lower at 260 ppm for the earliest five interglacials.
- b.The 2015 atmospheric CO2 concentration is around 400 ppm. This is about 120 ppm higher than in the most recent four interglacials, and about 140 ppm higher than the earliest five interglacials in the EPICA Dome C record.
You now have data that you could possibly use to predict what might happen as a result of the increasing CO2 concentration that Keeling detected. You could theoretically plot a graph of temperature against CO2 concentration to highlight the correlation and, from this, read off the temperature for any given CO2 concentration. Unfortunately, there is a problem with this. The current atmospheric CO2 concentration is higher than at any time in the previous 800 000 years, so even if you had a graph of the mathematical relationship between temperature and CO2 concentration from the earlier data, it would not include the current (and much less, any possible future increased) CO2 concentration. You would have to extrapolate (that is, extend) the graph beyond the available set of values, and you do not know enough from this data alone to be sure that the relationship will hold outside these limits. This means that it is difficult to use information from these earlier periods to predict what may happen in the future.
It is possible to be fairly sure that Milankovitch cycles amplified by greenhouse gases are at least partly responsible for the coming and going of ice ages; it is the best theory and one to which almost all climate scientists subscribe. But as you have seen, it is not a complete explanation, and some of the earlier cycles do not conform to this theory. To make useful predictions for the near future, and hence to suggest actions to protect the environment, you need to look for some more detailed information and more accurate scientific models.