5.2 Ice-albedo feedback loop
You have learned that the Earth’s albedo refers to the proportion of solar energy that reaches the Earth’s surface and is reflected straight back out into space. Section 2.1 explained how different surfaces on the Earth have a different albedo and so reflect a different amount of solar energy. Ice has a much higher albedo, and so reflects a much greater amount of solar energy, than the surface of the oceans.
Activity 12 The changing mean albedo
What is likely to be the effect of these changes in ice cover on the albedo of the Arctic region?
Discussion
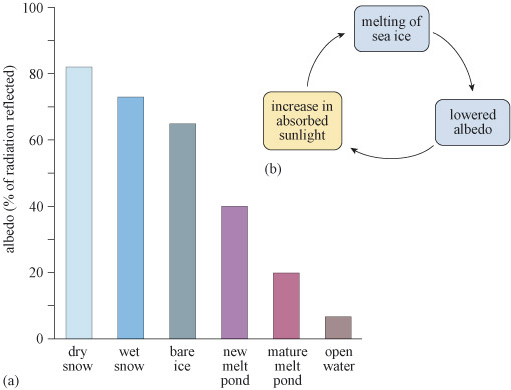
Recall from Table 1 that the albedo of open water is 3% and that of sea ice is 40%. So the increased thawing during summer will decrease the albedo, so that less energy will be reflected back into space, and more energy will be absorbed.
The effect on the albedo is actually more complex than suggested by Activity 12, but this ice–albedo feedback loop (Figure 30(b)) is potentially very important. Table 1 gives the average albedo of sea ice as approximately 40%. Sea ice is not uniform, and it could consist of a mixture of bare ice, ice with snow on (the snow could be either wet or dry) or even ponds of fresh water on the ice as it melts, and each one of these types has a different albedo.
As temperatures rise there will be more bare ice, melt ponds and open water, and the overall albedo will decrease. This means that less energy will be reflected, so more solar energy is absorbed by the ocean, causing further warming and ice melting. The ice–ocean system is in a positive feedback loop, and changes such as melting ice naturally lead to more melting ice.