

1.3 Individual and household carbon footprints
There are different ways of measuring the carbon footprint. The production perspective counts the greenhouse gas emissions produced by the power stations, factories, transport services, farms, buildings, etc., in different sectors of a country’s economy – energy supply, manufacturing, transport, agriculture, construction, etc. From this perspective the producers of goods and services within each country are mainly responsible for that country’s emissions, while households are responsible for only a relatively small percentage (about a fifth) of the total.
The consumption perspective, on the other hand, considers that the purpose of a modern economy is to provide individuals and households with the energy, transport, food and other goods and services they need and want. So individuals and households, as final consumers of all these things, are ultimately responsible for triggering the emissions involved in producing and distributing them, whether at home or imported.
As the focus of this course is on the carbon footprint of individuals and households, and that’s what the carbon calculator, which you’ll be using later, measures, we will be looking at the consumption perspective. While individuals and households may be ultimately responsible for triggering most GHG emissions, they don’t directly control how much of those emissions are produced and so can’t be expected to reduce them unaided. There will be more about this later.
There are different ways in which this consumption-based carbon footprint is measured and broken down, which produce differing results. In this course it’s not the exact numbers that are important, but the general principles.
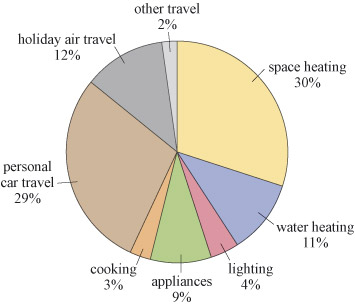
The official convention is that only the CO2 from home heating and car driving is counted as an individual’s or household’s direct emissions. Everything else, including emissions from domestic electricity use, car manufacture and maintenance, public transport and personal flights is indirect because it arises from systems not directly controlled by individual consumers. But from an individual’s or householder’s perspective, all home energy use, including electricity, and all transport, including travel by public transport and air, may more logically be viewed as emissions arising directly from their actions. Meanwhile emissions from the production and supply of food and all other goods and services may be viewed as arising indirectly from the actions of others. Viewed from this perspective, Figure 3 shows a breakdown of direct emissions (DTI, 2007).
Study note: Pie charts
A pie chart shows different amounts as slices of a circular pie. The whole pie represents the total (100%) amount, so a pie chart is useful for displaying percentage breakdowns.
What does Figure 3 show?
- It is a pie chart and shows the percentage breakdown of the average annual direct carbon emissions of an individual living in the UK. Although this chart is based on 2004–5 data, recent studies show that this direct carbon footprint has not changed significantly.
- The emissions per person in the caption are given in tonnes of carbon (C) rather than carbon dioxide (CO2). Carbon is just another unit for measuring GHG emissions. So always check whether emissions are given in kilograms or tonnes of C, CO2 or CO2e and convert if necessary (see Study note: Converting carbon to CO2 (or COe) emissions).
- The pie chart is based on carbon dioxide emissions alone and doesn’t include other greenhouse gases. But as the emissions involved arise from burning fossil fuels for energy and transport, they consist mainly of CO2. The chart therefore provides a realistic footprint breakdown.
If you look closely at Figure 3 you can see that:
- space (i.e. room) and water heating (41%) and personal car travel (29%), account for the biggest part of an UK individual’s average direct carbon footprint (70% of the total)
- other important carbon footprints arise from powering appliances, including electronic equipment, and lights (13%) and holiday air travel (12%) (25% of the total)
- cooking (3%) and other travel (public transport and motorcycles, 2%) create relatively minor average individual carbon footprints (5% of the total).
As you’ve seen, the direct carbon footprint given in Figure 3 (about 1.16 tonnes carbon or 4.25 tonnes CO2 per person per year) covers only household energy use and personal travel. It doesn’t include the indirect footprint from consumption of food and other goods and services. You will look at the total footprint in Section 1.4.