

1.4 Total footprint
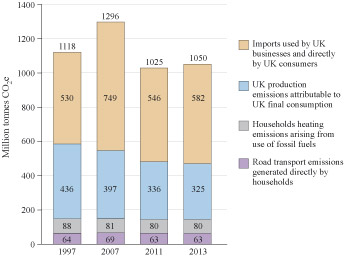
The UK Government publishes information on the country’s carbon footprint, covering both direct and indirect annual GHG emissions, including the emissions embedded in imports. This provides a comprehensive picture of the UK’s total carbon footprint from the consumption perspective (Figure 4).
You’ll notice that, where possible, for UK data publications from government departments such as DEFRA (Department for Environment, Food & Rural Affairs) and DECC (Department of Energy & Climate Change) have been used. The names and responsibilities of these departments can change in government reorganisations (e.g. in 2016, DECC became part of the Department for Business, Energy & Industrial Strategy) but remain an invaluable source of information and statistics.
Study note: Stacked bar charts
Figure 4 is a bar chart, another way of showing the breakdown of numerical information. This is a ‘stacked’ bar chart, in which the components that make up the total are shown within each bar.
Notice that in Figure 4 the direct carbon footprint of households (the purple and grey sections of each bar) is relatively small. This is because (unlike in Figure 3) this breakdown uses the official convention, mentioned earlier, in which household electricity for lighting and appliances, travel by public transport and holiday flights are considered as indirect sources of emissions. The total indirect carbon footprint (the blue and brown sections) includes these emissions plus the emissions arising from food, goods and services both produced in the UK and embedded in imports.
This and other studies have shown that about half the UK carbon footprint is the result of the GHG emissions embedded in imports, notably electronic products, clothing and motor vehicles from the EU and Asia. This means that the emissions from an individual’s consumption of imported goods and services have become a major part of their carbon footprint. This proportion is expected to increase, at the same time as the emissions arising from their consumption of energy, goods and services produced within the UK decrease (Barrett et al., 2011; Committee on Climate Change (CCC), 2013).
Also included in the total carbon footprint in Figure 4 are emissions from government activities, including public administration, health, education, defence and capital investment, for example, in railways. This residue, which arguably can’t be allocated to households, amounts to 10% to 20% of the total UK carbon footprint.
This means that consumption decisions by individuals and households are responsible for creating or triggering 80% to 90% of the UK’s carbon footprint (Barrett et al., 2011). This proportion is not unusual for a developed country where final consumption of energy, food, and other goods and services by individuals and households accounts for most economic output.
Now complete Activity 1 to test your understanding of the carbon footprint.
Activity 1 The carbon footprint
- a.What is the carbon footprint?
Answer
The carbon footprint is the total annual mass of ‘carbon’ emissions which result directly or indirectly from the activities of an individual or a group of people, from an event, or from providing a product or service.
- b.Give three different ways of measuring the carbon footprint (in terms of how the mass of emissions is calculated).
Answer
‘Carbon’ emissions can be measured as the annual mass in kilograms or tonnes of either:
- carbon dioxide (CO2) gas; or
- total GHGs converted to carbon dioxide equivalents (CO2e) in terms of their global warming potential; or
- the carbon (C) content of CO2 (or CO2 converted to CO2e).
- c.Look at the caption for Figure 3 in Section 1.3. The average UK individual’s direct carbon (C) emissions are given as 1.16 tonnes per person per year. What is this mass expressed as CO2 emissions?
Answer
Based on 2005 government information, the average direct carbon footprint of an individual living in the UK was 1.16 × 44/12 = 4.25 tonnes CO2 per person per year. This footprint was unchanged in more recent studies (e.g. Preston et al., 2013).
c.
- d.What are the main components of an average carbon footprint of an individual living in the UK?
Answer
The main components of a UK individual’s or household’s average carbon footprint are:
- home energy use, especially for room and water heating and running lights, electronics and appliances
- transport, especially driving and flying
- consumption of goods and services, produced at home and imported
- government activities and public services.