

2.1.2 The effect of incomes and household types
The carbon footprints given in Section 2.1 are averages (means) for a UK inhabitant. But, as mentioned earlier, footprints differ considerably for different individuals and households.
A factor which has a major effect on the footprint is individual or household income (a distribution of which was shown in Figure 6). In general, the higher a person’s or household’s income is, the higher their carbon footprint will be. This is not just because wealthier people generally consume and travel more, but because, even if they save a lot, their savings will be invested to produce products and services for consumption, which indirectly adds to their footprint.
For example, the study that provided the Table 1 breakdown also showed how the footprint per person differed for ten groups, from households with the lowest 10% to households with the highest 10% of UK incomes (Figure 7).
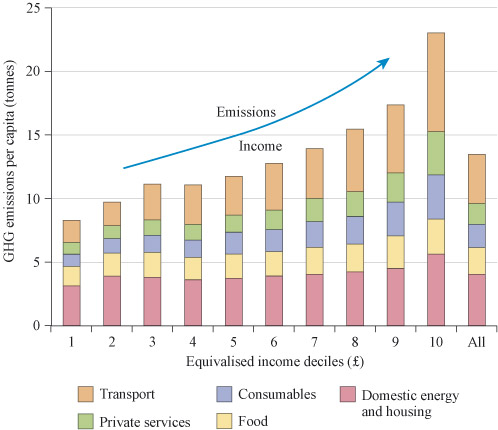
Look carefully at Figure 7. Can you see that the carbon footprint per person for households with the highest 10% of incomes is about three times that of people living in households with the lowest 10%? This is true for all categories, but especially for consumables (goods), private services and transport.
A similar income-related pattern has been shown for the direct carbon footprint that just includes energy use and transport. The richest 10% of households have three times the footprint (including the emissions from energy use in the home and all personal travel by car, public transport and air) of the poorest 10% (Preston et al., 2013).
Thus wealthier people generally have a greater environmental impact than poorer people and so arguably have a greater responsibility for reducing their footprints.
The carbon footprint per person also varies with household size and composition. The Table 1 study also showed how the carbon footprint per person varied for different sizes and types of household (Figure 8).
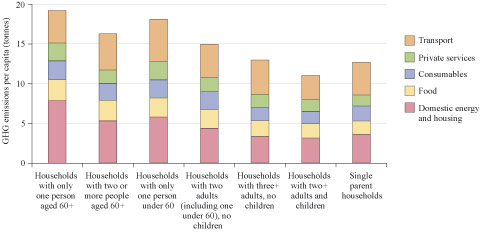
Figure 8 shows that one-person households (bars one and three) generally have heavier footprints per person than those with two or more members, including children (especially bars five and six). This is because people living alone usually occupy and heat a bigger space per person and don’t share as many goods and services as larger households.
So, one of the barriers to reducing carbon footprints is the growing number of one-person households (now nearly a third of all UK households). Sharing your home, therefore, can be one of the most effective ways of reducing your individual footprint.