

2.3.1 Carbon footprints per person
The statistics clearly show huge differences between countries in carbon footprints per person. Table 2 shows the mean annual footprint per person for selected countries in 2011, when the latest reliable data for all countries were published by the United Nations (UN), plus estimated footprints for 2015 from another source. These footprints are for territorial emissions of CO2 and so do not include imports and exports. Hence in Table 2 the mean carbon footprint for a UK inhabitant is 7.2 tonnes of CO2 alone rather than 14 to over 16 tonnes of CO2 equivalent GHG emissions discussed in previous sections. That’s because about half of the UK footprint is emissions embedded in imports.
| Country | CO2 per person, tonnes per year (for 2011, rounded) | CO2 per person, tonnes per year (estimates for 2015, rounded) |
| Saudi Arabia | 18.7 | 19 |
| United States | 16.8 | 17 |
| Australia | 16.2 | 17 |
| Russian Federation | 12.6 | 11 |
| Japan | 9.3 | 9.8 |
| Israel | 9.2 | 8.9 |
| South Africa | 9.2 | 8.5 |
| Germany | 8.8 | 9.9 |
| Ireland | 8.0 | 7.9 |
| United Kingdom | 7.2 | 6.4 |
| China | 6.6 | 7.5 |
| Sweden | 5.5 | 4.3 |
| France | 5.3 | 5.3 |
| Thailand | 4.6 | 4.6 |
| Turkey | 4.4 | 4.9 |
| Romania | 3.9 | 3.8 |
| Egypt | 2.8 | 2.4 |
| Brazil | 2.2 | 2.5 |
| India | 1.7 | 1.7 |
| Pakistan | 0.9 | 0.9 |
| Nigeria | 0.5 | 0.6 |
| Uganda | 0.1 | 0.1 |
| World average (mean) | 4.8 | 4.9 |
Figure 9 shows estimated footprints for more countries presented in graphical form for the year 2015.
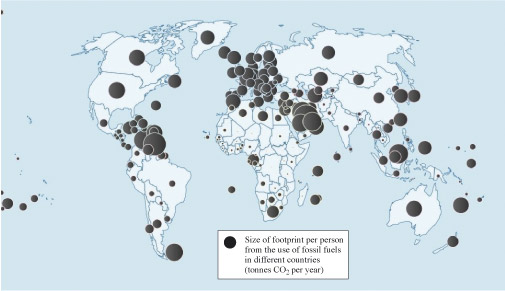
Having reviewed Table 2 and Figure 9, now complete Activity 4.
Activity 4 International comparisons
Look at the data for 2015 in Table 2.
How heavy is the mean territorial carbon footprint of a UK inhabitant (in tonnes CO2 per person per year) compared to the mean footprints of inhabitants of the USA, China, Sweden, India, Uganda and the world mean? Round your answers to the most appropriate number of significant figures (see Study note: Rounding numbers, decimal places and significant figures).
Here’s an example. UK divided by Brazilian CO2 emissions = 6.4/2.5 = 2.56 = 2.6 rounded to two significant figures. Thus, the mean carbon footprint of a UK inhabitant is over two and a half times heavier than the mean for a Brazilian.
| Country | Mean footprint per person (tonnes CO2 per year) | UK mean footprint per person relative to other country’s mean footprint per person |
| UK | ||
| USA | ||
| China | ||
| Sweden | ||
| India | ||
| Uganda | ||
| World mean |
Discussion
The mean carbon footprint of a UK inhabitant in 2015 relative to that of other countries was:
| Country | Mean footprint per person (tonnes CO2 per year) | UK mean footprint per person relative to other country’s mean footprint per person |
| UK | 6.4 | — |
| USA | 17 | 0.38 |
| China | 7.5 | 0.85 |
| Sweden | 4.3 | 1.5 |
| India | 1.7 | 3.8 |
| Uganda | 0.1 | 60* |
| World mean | 4.9 | 1.3 |
* to 1 significant figure
How realistic are these comparisons? They show clearly that, because people in rich countries generally consume more and have more energy-intensive lifestyles than people in poorer countries, they have heavier mean carbon footprints. But it doesn’t mean that the inhabitants of a rich country inevitably have heavy footprints. The inhabitants of Sweden, for example, have only about a quarter of the mean footprint of Americans. This is at least partly because of the low-carbon electricity supplies in Sweden.
But remember that these are figures for territorial CO2 emissions. This is because few countries publish consumption emissions that include imports and exports. On a consumption basis, the emissions embedded in Chinese exports to the UK, for instance, are counted as belonging to UK consumers rather than Chinese producers. So, more realistically, the mean footprint of a UK inhabitant is about twice that of an inhabitant of China, rather than a bit smaller (CCC, 2013).