
3.1 Surface water
River water quality is important because rivers are a major source of water used for drinking and by industry. Rivers also support a wide variety of wildlife and in some areas of the world are used extensively for recreation. Chemical and biological quality is affected by the management of abstractions from rivers and groundwaters and how effluent returns to them, and by the design and maintenance of navigation and flood control measures.
In the UK, discharges into surface waters require the consent of the pollution control authority: the Environment Agency (EA) in England and Wales, the Scottish Environment Protection Agency (SEPA) in Scotland and the Northern Ireland Environment Agency of the Department of Agriculture, Environment and Rural Affairs in Northern Ireland.
River water quality is one of the UK government's headline indicators of sustainable development. These are a 'quality of life barometer' measuring everyday concerns like housing development, health, jobs, air quality, educational achievement, wildlife and economic prosperity. The indicators provide an overview of national progress towards a more sustainable economy, society and environment. The SDIs are used as a means of assessing whether the nation as a whole is developing sustainably, and as a means for policy-makers to identify more sustainable policy options (DEFRA, 2013). River water quality is measured by indicators of chemical quality and biological quality. In England, Wales and Northern Ireland, three measurements are used for the chemical quality classification of river water: BOD, dissolved oxygen and ammonia. In Scotland, iron and pH are also included. Biological testing provides a more comprehensive picture of the health of rivers and canals, and is based on the monitoring of tiny animals which live in or on the bed of the river. Species groups recorded at a site are compared with those which would be expected to be present in the absence of pollution, allowing for different environmental characteristics in different parts of the country.
Table 2 gives chemical quality data for the rivers in the UK in 2002. Overall for the UK, it is estimated that about 95% of rivers were of good or fair chemical quality in 2002. These estimates are approximate because the classification scheme in Scotland differs from that in England, Wales and Northern Ireland. There has been an improvement in the proportion of rivers of good or fair quality in the UK since 1990 (Figure 10). This conclusion is based on a comparison of the trends for individual countries—an exact percentage change cannot be given because of changes both in monitoring methods and the monitored river networks through the period. Regional variations in England and Wales are illustrated in more detail in Figure 11.
| % of classified river length | Total river lengths classified/km | ||||
| Good | Fair | Poor/Bad | |||
| England | 65 | 28 | 6 | 36 170 | |
| Wales | 92 | 6 | 2 | 4570 | |
| Northern Ireland | 55 | 42 | 4 | 4130 | |
| Scotland | 86 | 10 | 4 | 25440 | |
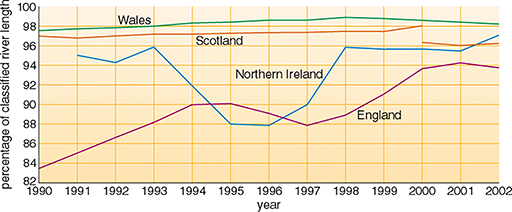

In 2002, approximately 95% of the UK's river network was classified as being of good or fair biological quality (Table 3). Between 1990 and 2002, the biological quality of rivers improved in England. In Wales almost all rivers are of good or fair quality. The river length used for biological monitoring in Northern Ireland was more than doubled between 1995 and 2000 and there was a fall in river length of good quality. In Scotland biological quality is generally high, but changes in monitoring and network definitions mean it is difficult to draw conclusions about trends.
| % of classified river length | Total river lengths classified/km | ||||
| Good | Fair | Poor/Bad | |||
| England | 68 | 27 | 5 | 33 500 | |
| Wales | 78 | 21 | 1 | 4 380 | |
| Northern Ireland | 57 | 40 | 3 | 5140 | |
| Scotland | 86 | 11 | 3 | 8 610 | |
Although there has been a general improvement in river water quality in England and Wales between 1990 and 2002, before this, between 1980 and 1990, there was a general deterioration of water quality. This deterioration was caused by a combination of greater discharges from sewage works, industry and farms, overland flow from farmland, and two years of low rainfall and hot summers. In the south-west, intensive agriculture was the main cause, producing large quantities of animal slurry and silage effluent. Drought and pollution from sewage works were the main causes in the Thames area. In contrast, river quality surveys before 1980 showed a gradual improvement: the Thames is an appropriate example of this (Box 3).
Box 3 The River Thames: pollution, cleanup, pollution, cleanup
The River Thames in London has had a history of pollution problems.
Before the 19th century, domestic waste from London was collected in cesspools and used as a fertilizer on agricultural land (the origin of the term 'sewage farm'). Water closets began to be introduced in the mid-19th Century, the waste flowing through sewers untreated to the Thames, and with the rise of industrial waste during the Industrial Revolution, which also flowed into the Thames, the river became highly polluted. The smell of the river was so bad that the Houses of Parliament (on the bank of the Thames) became a very unpleasant place to be and, in the best NIMBY ('not in my backyard') tradition, spurred Parliament to pass laws to control discharges to the river. London's sewage was piped downstream of the city where it was discharged, still untreated. This produced some improvement, and by the end of the 19th century the river quality began to improve (Figure 12). A good quality river will have an oxygen level close to 100% saturation—but if a river is polluted, oxygen in the water will be used in the breakdown of organic pollutants (Section 2) and the oxygen concentration will fall. The oxygen in the river in Figure 6, for example, was reduced to about a quarter just downstream of the sewage outfall.
However, by the mid-20th century, increasing population and industrialisation, poor sewage treatment and sewer damage during the Second World War caused pollution of the river to increase, and oxygen was almost absent over a 60 km stretch of the River Thames by the 1950s (Figure 12). This part of the river contained water of very poor quality, and fish were absent. Since the 1950s, however, more extensive and improved treatment of sewage before the effluent is discharged to the river has improved the quality of the water.

Activity 4
From Figure 11, how does the chemical river quality of the river(s) where you live (or if you live outside England and Wales, at the location of the Open University, about 80 km north of London) compare with the average for England or Wales (Table 2)?
Answer
Your answer to this will obviously depend on where you live. Near the OU in Milton Keynes the class of rivers is generally B, good. This compares well with the national average; 65% of English rivers fall into Classes A, B and C in Table 2.
On an international scale, cleaning up polluted rivers or lakes is more complicated when they pass through more than one country. For example, the River Rhine has parts of its catchment in eight countries, and an almost total lack of pollution control resulted in the Rhine being one of the most polluted large rivers in Europe for many years (Box 4).
Box 4 The River Rhine: attempts at international management of pollution
The headwaters of the River Rhine are in the Swiss Alps. It then flows through one of the most industrialised and densely populated areas of the world in Germany, France and the Netherlands. The Rhine river catchment area is 190 000 km2. In the past, countries tended to dump waste into the River Rhine and then leave it to be dealt with by the next country downstream. There are 58 million inhabitants in the highly industrialised Rhine river basin, and their domestic and industrial wastes, often untreated, go into the river. Parts of the Rhine basin are intensively farmed, and fertilizers and agricultural chemicals also add to pollution in the river. The uses are often at odds with each other; for example, the Netherlands needs Rhine water for irrigation, but the high salinity of the Rhine, which can reach 600 mg l-1 at the Germany-Netherlands border, and comes mainly from French potash mines, can make the water unsuitable.
International agreements and cooperation have been necessary to reduce pollution of the river. At the insistence of the Netherlands, which was concerned about increased salinity, France, Germany, Luxembourg, the Netherlands, and Switzerland began discussing arrangements for reducing pollution in the 1950s, and formed the International Commission for the Protection of the Rhine against Pollution (IKSR) in 1953. This was a technical commission, charged with monitoring pollutants. To stem increasing pollution from industrial and municipal sources, the parties to the IKSR signed the Convention for the Protection of the Rhine against Chemical Pollution in 1976. In 1986 they agreed to the Rhine Action Programme, which seeks to produce drinkable water from the Rhine, reduce sediment pollution, and restore the Rhine environment so that aquatic life returns. The IKSR parties agreed to a 50% reduction (from 1985 levels) in the discharge of 30 priority pollutants into the river by 1995, and this was achieved. France, Germany, the Netherlands and Switzerland agreed to share costs of $136 million. In the summer of 1991, the German chemical industry federation agreed to reduce the discharge of toxic chemicals into the Rhine. These international efforts, combined with domestic pollution controls, particularly sewage treatment, have produced measurable benefits: since the early 1970s, concentrations of heavy metals have fallen and biological treatment of organic waste has reduced oxygen depletion and fish deaths.
There has been some success in reducing pollution; metal pollution has declined considerably, mainly due to better industrial sewage treatment. However, so far (2004), international agreements have failed to control some key pollutants; salt pollution is still a problem and desalination would be expensive. Nitrate concentrations, mainly because of heavy fertilizer use, continue to rise, and groundwater in Germany is increasingly contaminated with nitrate and pesticides. There is also the danger of accidental pollution. In 1986 a warehouse full of pesticides caught fire near Basel, Switzerland. The water used to control the fire washed 10 000 tonnes of toxic chemicals into the river, killing fish and other living organisms for several hundred kilometres downstream.
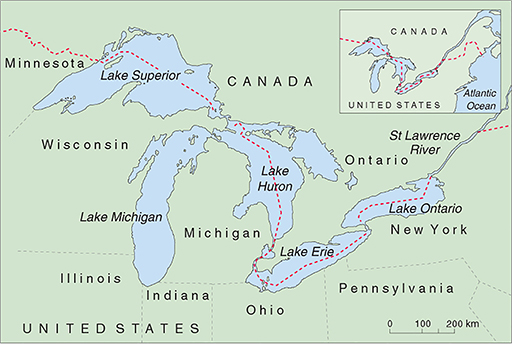
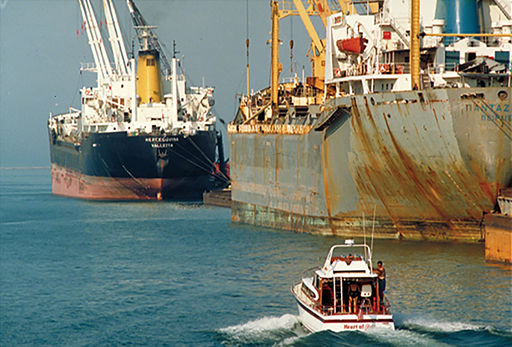
The North American Great Lakes (Figure 13) also have major pollution problems. The Great Lakes are the world's largest freshwater ecosystem, with a catchment area of around 520 000 km2. The lakes are interconnected, and have just one outlet to the sea, through the St Lawrence River to the Atlantic Ocean. They have many uses — as a large freshwater fishery, a source of water and hydroelectric power, transport by shipping (Figure 14), and recreation—and are surrounded by urban, agricultural and industrial development. This vast area falls under the control of eight US states and Canada.
The problems of the Great Lakes began with logging, which polluted the rivers with sawdust, followed by indiscriminate fishing, untreated sewage disposal which caused cholera and typhoid outbreaks in the early part of the 20th Century, and lastly industrial waste disposal that was a particular problem from the 1950s. Lake Erie is bordered by five states, each of which dumped untreated sewage, acid, oil, iron and other industrial waste into the lake; by the 1960s the lake suffered from algal blooms and beaches were covered with rotting algae and dead fish. Many aquatic species became locally extinct and the fishing industry of Lake Erie was destroyed. This crisis provided an impetus for Canada and the USA to reduce sewage and industrial waste-water discharges into the lakes and rivers, but despite these stricter regulations pollution is still a problem. Only about 1% of the water in the system flows out to sea each year, so pollution of the water and in the bottom sediments tends to remain for a long time. Persistent organic chemicals and toxic metallic salts are the biggest problem.