
Determining the size of the problem
Having a framework for best environmental options for waste management is, of course, all very well; putting such things into practice is another matter. In the UK, you may be familiar with the ‘3Rs’ – ‘reduce, reuse, recycle’ – often used in waste awareness and recycling campaigns to encourage people to change their behaviour, which may not always be easy or straightforward to achieve.
Before an environmentally acceptable system of waste management can be developed, the size of the problem needs to be determined. This should be followed by a formal collection system for MSW and then the best possible environmental option used for treating the waste.
A significant issue is that data are not systematically collected for China as a whole; the data are sketchy and patchy. But China is not exceptional in having poor waste data. In the UK, waste generation statistics were not always reliable even into the 1980s and even today, waste data are often described as ‘estimated’.
Data are difficult to collect and may not be collected every year, so while it may be several years old, it could still be the best available. Not only does the amount of waste to be collected and managed need to be ascertained, but its composition needs to be known as different strategies of waste management may be more appropriate for different parts of the diverse mix of material in household waste. Table 1 shows some estimates of MSW generated for a selection of countries.
| Country | Annual generation of MSW (million tonnes) | Population (millions) | Annual generation per capita (kg/person) |
| China | 171 | 1371 | |
| Germany | 50 | 81 | |
| South Korea | 18 | 50 | |
| UK | 31 | 65 | |
| USA | 228 | 321 |
Footnotes
*Note that the column on the right-hand side has been left intentionally blank because you will calculate this information as part of Activity 2.Activty 2 MSW generation per person
Using the data in Table 1, calculate the annual generation of MSW per person for the countries shown and add these into the free response boxes in the table. Then summarise the data for China and the USA in a sentence or two.
Answer
| Country | Annual generation (million tonnes) | Population (millions) | Annual generation per capita (kg/person) |
|---|---|---|---|
| China | 171 | 1371 | 125 |
| Germany | 50 | 81 | 617 |
| South Korea | 18 | 50 | 360 |
| UK | 31 | 65 | 477 |
| USA | 228 | 321 | 710 |
Sample calculation for South Korea
The amount of waste in one year is 18 000 million kg, as there are 1000 kg in 1 tonne.
So
The data show that China generates a large amount of MSW annually, but it has the lowest per capita rate of the selected countries. On a per person basis, it has the lowest rate per capita of the countries selected. The USA generates the highest amount of MSW and it also has the highest per capita rate.
Although waste data are poor and not systematically collected in China, there are some estimates which suggest that the rate of growth of MSW is unprecedented. Determining precise growth rates year on year is not possible without reliable data, but it is possible to estimate a trend over time using data published at specific points over the last few decades combined with some future projections.
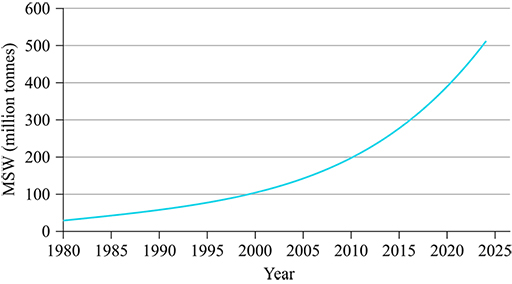
MSW generation is estimated to have risen from around 30 Mt in 1980 to around 100 Mt at the turn of the century (Wang and Nie, 2001, cited in Zhang et al., 2010), almost doubling to just under 200 Mt by 2010 (Zhang et al., 2010). The World Bank projects China’s MSW to increase to over 500 Mt by 2025 (Figure 8), accounting for nearly one-quarter of the amount of MSW expected to be generated by the entire world (Hoornweg and Bhada-Tata, 2012).
Activity 3 Growth of MSW
- a.What word would you use to describe the growth rate shown in Figure 8?
- b.What might be the daily production of MSW in 2025?
Answer
- a.It seems that China’s growth rate of MSW is also exponential.
- b.If the rate of growth of MSW depicted in Figure 8 continues, the annual production of MSW in China in 2025 can be estimated to be approximately 550 million tonnes. To estimate the amount of waste generated daily, this figure needs to be divided by the number of days in a year: 550/365 = 1.5 million tonnes per day.
The current best estimates of how China manages its waste are shown in Table 2, with a comparison with the same selected countries as in Table 1.
| Country | Landfilled | Incinerated | Recycled | Composted | Year |
| China | 61.5 | 21.0 | no data | no data | 2012 |
| Germany | 0.3 | 33.7 | 46.6 | 17.2 | 2014 |
| South Korea | 15.6 | 25.3 | 58.7 | 0.4 | 2013 |
| UK | 27.8 | 26.5 | 27.3 | 16.4 | 2014 |
| USA | 53.8 | 11.7 | 26.0 | 8.5 | 2012 |
One of the first things that should strike you about Table 2 is that China appears to do little recycling. even if you assume that the 17.5% of ‘missing’ MSW is diverted into recycling. The picture presented is that China landfills or incinerates most of its solid waste. This shows the difficulty of assembling waste data when no one has full control over all the ways in which waste is managed.
So how might China ‘grow green’ in its management of MSW, and can it use the waste hierarchy better? Some possible strategies are outlined in the next sections.