
1.1 What is worth recording?
From an archival point of view it could be argued that it is worth recording anything that changes and that can be reliably measured. If it is not known exactly how to use the data now, a good scientific record might be valuable at a later date. From a practical point of view, the important measurements are those that have a known bearing on events.
Suggest at least six meteorological quantities that are locally measurable and that might form the basis for a scientific weather forecast.
Here is a possible list: atmospheric surface pressure; air temperature; wind speed and direction; humidity; amount of rainfall or other precipitation; cloud amount, height of cloud base and cloud type; visibility.
The quantities just listed are commonly included in reporting of data for meteorological forecasts and/or for climatological archives. Many meteorological reports list extreme values (such as daily minimum and maximum temperatures), temperature averages, and net accumulations of precipitation over defined periods of time. Daily maximum and minimum temperatures are often taken over a 24-hour period starting at 9 a.m. local time each day rather than midnight. This is to avoid dividing each night in half; one very cold night might then contribute minimum temperatures (one at just before and one after midnight) which would appear in the record as minima for two successive days.
A vessel designed to catch precipitation can be emptied at set intervals; the accumulation over a period is simply the depth of water collected over the time interval until the instrument is next checked. (This kind of instrument is called a 'rain' gauge, even if it catches hail or snow rather than rain.) Note that similar accumulations might result if there was a single rain storm for a short period during an otherwise dry day, or a continuous drizzle. Figure 1 shows one example extract of an hourly record from which it is easy to see not only the current weather conditions, but just as importantly, how they are changing. Notice that alongside the pressure reading is an indication that the pressure is falling. You should recognise that, though it may take a few more hourly reports to confirm it, this suggestion of decreasing pressure could be early warning of the approach of a low-pressure weather system.
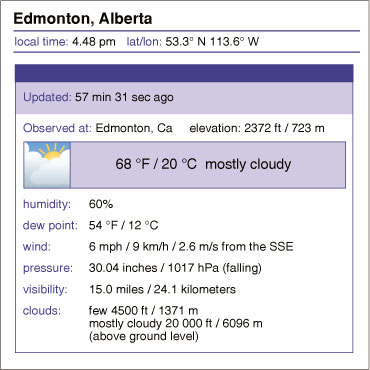
Somewhere between the observations like those recorded in Figure 1 and a weather forecast is a team of professional meteorologists. No doubt among them will be those whose tasks include a consideration of the observers' reports of cloud type, which is a rich source of immediate weather information. It is interesting that few reports available to the general public include the raw information on cloud classification or a realistic measure of cloud extent, although a simple pictogram is often used to describe the cloud cover.