

1.4 The global perspective
Local observations are a key ingredient in short-term, local weather forecasting but the data from the global network of ground-based observations are also important in setting initial conditions in larger-scale models for longer-term forecasts. Worldwide cooperation on weather can be traced back to 1873. Nowadays, the World Meteorological Organisation (WMO) coordinates the international exchange of meteorological data. In 2007 the WMO was collecting and freely distributing meteorological data from more than 100 moored buoys, 1000 drifting buoys, 7300 ships and around 10,000 land-based weather stations. These surface data traditionally form the basis of weather forecasts, risk assessments and weather warnings around the globe. Figure 3 shows the extent of the global coverage by international weather stations on the surface.
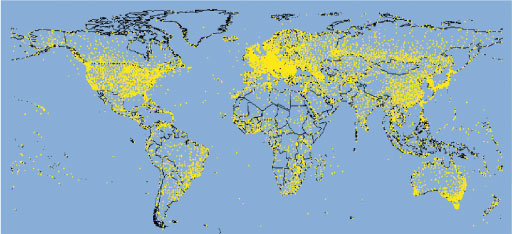
Examine Figure 3 carefully. How does the distribution of surface observation sites on land compare with that of sites at sea?
The distribution of surface observation sites across the globe is not uniform primarily because the oceans are more sparsely covered by observing stations than the land.
Suggest some reasons for the land coverage not being uniform.
The land coverage to some extent reflects a combination of population density and economic factors, with richer and/or more densely populated areas being better represented. Population density also reflects geography; deserts and high mountains are usually sparsely inhabited.
Why is there a relative imbalance in coverage between the Northern and Southern Hemispheres?
The Southern Hemisphere is under-represented in terms of coverage, because compared with the Northern Hemisphere there is relatively little land area - the surface is predominantly ocean.
Activity 1 Meteorological instruments (part 1)
In this course's activities you will study images of many different instruments that are used by professional meteorologists to gather meteorological data and see examples of some of the information that they provide. There are three activities, one for each major section of this course. The first part deals with surface-based instruments.
Open the image bank [Tip: hold Ctrl and click a link to open it in a new tab. (Hide tip)] . You will find that there are 38 images divided into three sub-sections, corresponding to the major sections of this course. The contents of each sub-section is given here.
You can use the search tab in the image bank to find the sub-sections. Clicking on a thumbnail gives you a larger image; to get back to the search results, use your web browser's back arrow. You may view the images in any order, but it is recommended that you open them in numerical order.
Before you start work on this image bank material, read through the study comment below and look at what is asked in Question 1. Then, as you look at the images and read the captions, make notes of any aspects of the measurement platforms that might be relevant to the entries you will make in Table 1.
Study comment
Two of the questions in this OpenLearn free course give you the opportunity to use tables for summarising ideas. Tables can provide a concise way of displaying information, whether quantitative or qualitative. In the case of qualitative information, tables are particularly useful when comparisons are required, as similarities and differences can be picked out more easily from a table than from paragraphs of text.
Like the activities, the questions are split into three (Questions 1, 3 and 5), and allow you to compile your own table of ideas related to the huge variety of instruments that can be used to make meteorological measurements. A phrase often used in this context is 'measurement platform'; this denotes anything (such as a surface station, a satellite or an aircraft) that can carry a number of instruments. The overall task is to compare the relative strengths and weaknesses of different components within the meteorological network as you read through this course and complete the activities.
Question 1
After studying the images in the surface-based instruments sub-section, put a few words into the first row of Table 1 to describe what you see as the obvious advantages and disadvantages of surface stations for making meteorological measurements and observations. You will probably find you want to revise or add to your answer once you have read the following sections and have made the comparison with other platforms, so the answer is given after Question 5 in Section 3.3.