

2.2 Observing the Earth in the visible and infrared
Satellites can do much more than just showing us what we would see if we were to be on board. They can also show us things that human eyes could not see. At its best, the human eye sees only what we call light, i.e. visible radiation. The Sun and other warm bodies also emit non-visible radiation, and you will be familiar with other types of radiation such as X-rays. The collective term for all these types of radiation is 'electromagnetic'. Box 2 explains what distinguishes the various kinds of electromagnetic radiation.
Box 2 The electromagnetic spectrum
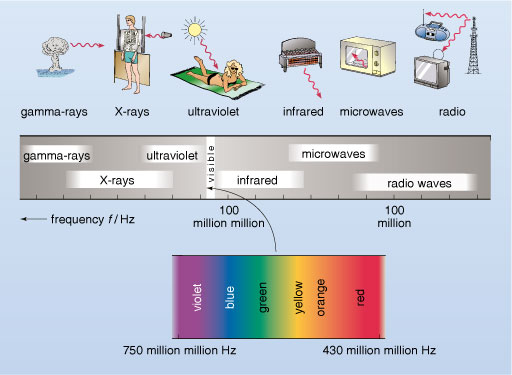
Sunlight is in fact a veritable rainbow or 'spectrum' of different colours that we describe as red, orange, yellow, green, blue and violet. Vegetation appears green because the chemicals within it mostly absorb the other colours, scattering the green light back to our eyes; a cloudless sky appears blue because of all the colours blue light is scattered the most (i.e. its direction of travel is most altered) on encountering very small particles high in the atmosphere; these have much less effect on yellow and red light. If there were no scattering, the daytime sky seen from the Earth's surface would mostly appear dark, as it does at night. From the surface of the Moon, which has no atmosphere, the sky always appears dark apart from the bright illumination from the direction of the Sun.
You may like to try a simple demonstration of light scattering yourself. You will need a torch and a large, straight-sided clear glass. Fill the glass about two-thirds full of water and then add about half a teaspoon of milk (you may need to experiment to get the correct proportions of milk to water). In a darkened room, shine the torch down onto the top of the water. The liquid should appear distinctly blue-ish if viewed from the sides, as blue light is scattered through a large angle by particles in the milk more effectively than the other colours, which travel from top to bottom. The sky appears blue (except when you look towards the Sun or at clouds) due to a similar scattering effect from tiny particles and molecules in the air. Then shine the torch upwards from below the glass and look down from above. You should see a red hue to the light which penetrates directly through the liquid, because the red light is least scattered by the small particles in the milk.
Although the human eye can't see it, the Sun's radiation is spread across a wider spectrum than the visible range (red to violet). There are 'colours' beyond each end of the visible spectrum: beyond the violet end there is ultraviolet (UV) radiation and beyond the red end there is infrared (IR) radiation. The human eye cannot detect UV radiation but bees' eyes apparently can. Most people are aware of UV in the context of sunscreen, because human skin tissue is damaged by UV resulting in sunburn. The human eye cannot detect IR radiation either, but it has been found that snakes' eyes have sensors that do, and the heat that we feel, for example from a glowing fire, is detected by infrared sensors in our skin.
You need to know a little more about radiation emitted by the Sun, by the atmosphere and from the surface of the Earth to appreciate the enormous insight into the weather that can be gained from satellite images. This radiation is described as being 'electromagnetic' because it can be understood in terms of the physics of electricity and magnetism. The physics of electromagnetism describes how electromagnetic radiation transports energy. It can also account for how electromagnetic radiation crosses the empty space from the Sun and stars to the Earth and beyond.
On encountering matter, radiation is transmitted, absorbed and scattered to varying degrees, depending on the chemical and physical nature of the matter. For example, the visible radiation in sunlight is certainly transmitted through panes of window glass, but some is also reflected (or scattered) by the glass, especially when it strikes the pane of glass at oblique angles. Scientifically the process is usually referred to as 'absorption' or 'excitation' if the radiation is converted into heat within the matter, and as 'scattering' if the path of the radiation is changed, but it is not absorbed. So on a sunny day the Earth's surface is heated by absorbing radiation from the Sun, whereas on a cloudy day much of this radiation is scattered back into space before it reaches the ground.
Our physiological experience of colour is just a means of expressing the response of the light-sensitive detector cells of the eye's retina to stimulation by different frequencies of electrical excitation. Red light stimulates these detectors electrically at around four hundred million, million times a second, whereas violet light stimulates them at almost twice that frequency. The way that the visible colours map into the wider electromagnetic spectrum over a broad range of frequencies is shown in Figure 7. The unit of frequency is the hertz (abbreviated as Hz).
The Earth is bathed in electromagnetic radiation from the Sun at a variety of frequencies though visible light is in the frequency range that reaches the Earth's surface most readily. Much of the incoming UV radiation is absorbed by a form of oxygen known as ozone which is most common high in the atmosphere. Some of the incoming visible radiation is reflected from clouds and land masses, but clouds are especially effective at blocking incoming IR radiation, which is also absorbed by atmospheric gases, including water vapour. The absorbed radiation warms the atmosphere, which itself emits IR radiation.
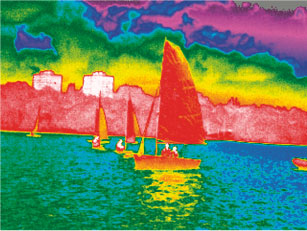
All warm objects emit IR radiation in amounts roughly in proportion to how warm they are. Thus, in complete darkness, the bodies of warm-blooded animals, including humans, can be imaged by IR-sensitive 'night vision' cameras (and by snakes), contrasted against a cooler, inanimate background. Making a camera that 'sees' IR radiation is not difficult in the digital age. Even the cameras built into many consumer electronic devices (such as some mobile phones and laptop computers) do so, though they are not specifically designed for this purpose. An IR image is shown in Figure 8.
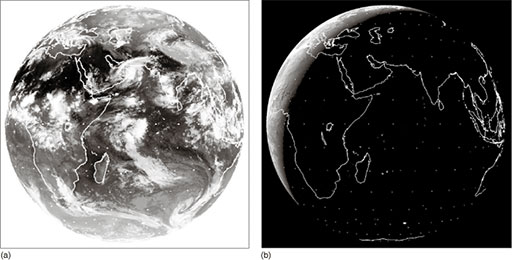
Both the Earth and its atmosphere emit IR radiation, a significant fraction of which escapes out into space, especially when skies are clear. As a result, IR cameras, mounted on satellites and looking back at the Earth, are extremely useful for weather observation on a global scale. Figure 9 shows IR and visible images from Meteosat-7, above the Indian Ocean. Unlike the artificial colour representation of Figure 8, the IR image of Figure 9 is presented as a grey-scale picture. This is normally the case for IR as well as visible images from meteorological satellites (compare with Figure 6). On the day shown in Figure 9, the Sun set at 6.19 p.m. local time in Kolkata, which is 5.5 hours ahead of UTC, so the Indian night was around half-way through at the time the image was taken. The visible image, Figure 9b, confirms that at the time most of the view was in darkness. The IR image of Figure 9a, on the other hand, shows lots of detail.
In a conventional black and white photographic print, what is represented by the light to dark contrast?
The lighter parts of a black and white picture come from the brighter surfaces of the scene being photographed - highlights and reflections are lightest; shadows and shade are darkest.
The conventional arrangement for 'black and white' photographic prints uses a positive image that looks recognisably similar to the real full-colour scene, whereas negative images reverse the contrast. Meteorological IR photographs are presented as a negative image: the darker regions correspond with the IR-emitting (i.e. warmer) surfaces and lighter tones tell of much reduced IR emission, i.e. relative coldness.
What colour does the view of space outside the disc of the Earth appear in the two images in Figure 9?
Space appears black in the visible, but white in the IR image.
Space is the coldest part of the image, being around 290 Celsius degrees colder than the average temperature of the surface of the Earth (which is around 15 °C).
What is the coldest thing visible within the Earth's disc in Figure 9a?
The cloud tops, which appear very light grey or white.
What is the warmest thing visible within the Earth's disc in Figure 9a?
The very dark-coloured land visible in the Sahara region of North Africa and in the Arabian Peninsula.
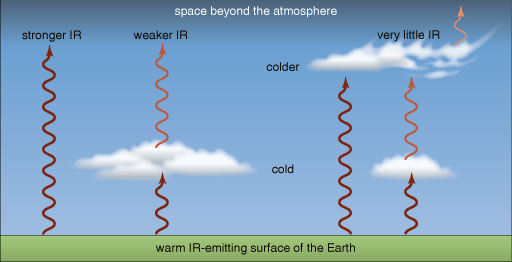
Land and sea surfaces are heated during the day and cool down at night but their temperature stays above 0 °C at low latitudes and they remain significant emitters of IR throughout the night-time. Clouds form in cold air and, in general, the higher the clouds are, the colder must be the tiny droplets and ice particles of which they are made; cloud tops are much colder than 0 °C and are not strong IR emitters. The whitest clouds in the IR image in Figure 9a are therefore also the highest. Lower-level clouds, which are more prevalent in mid-latitudes in this image, are a mid-grey tone. Figure 10 shows the relative amounts of IR radiation emitted by the Earth's surface and clouds.
In Figure 9a you should now try to identify the following features.
- The cold, high cloud over most of India, where the image is very light. The IR emission from the land is absorbed by the cold, high cloud and all the camera registers is the small amount of emission from the top of the cold clouds.
- A band of clearer skies that extends over North Africa, Saudi Arabia, Iraq, Iran, Afghanistan and Tibet, where the darkness of the image shows strong IR emission from warm land masses.
- The very sharply defined northern edge to the cloud-free region just to the north of India that corresponds with the Himalayan range.
- A region of cold, high cloud near the bottom of the Persian Gulf. This is partially veiling lower cloud spiralling anticlockwise in a (Northern Hemisphere) low-pressure system.
- A (Southern Hemisphere) low-pressure weather system in the Southern Ocean, at the bottom right of the image, with the cloud spiralling in a clockwise direction.
In general a rich variety of weather patterns can be read from an infrared global image, traced in layers of cloud even, as you have seen in Figure 9, when the picture is taken at night. A yet more vivid impression of developing weather can be seen in a sequence of successive images. Meteorologists can make use of sequences of cloud images to measure the wind speed and direction in the atmosphere at levels where clouds are present. Video clips of this nature make fascinating viewing.
Study comment
The following question gives you another opportunity to use a table layout to summarise and compare qualitative information.
Question 2
The top two rows of Table 2 show how various types of area visible in satellite images interact (or don't) with sunlight, and whether they emit IR radiation. These rows have been partly completed. Fill in the empty boxes. [Tip: hold Ctrl and click a link to open it in a new tab. (Hide tip)] (You may find Figure 10 is helpful.) The bottom two rows of the table categorise the grey-scale visible and IR images captured by satellites. These rows have also been partially completed. By referring to your entries in the top two rows and to Figures 6 and 9, fill in the remaining empty boxes.
Answer
The completed table shows all the boxes completed.
| Ocean | Land | Low-level clouds | Very deep clouds | Space | |
| Interaction with sunlight | Absorb sunlight | Scatter sunlight back into space | No scattering or absorption of sunlight | ||
| Emission of IR radiation | Radiate IR strongly upwards into space | Radiate very little IR | No radiation of IR along satellite line of sight | ||
| Visible image (positive) in daytime | Black | Various shades of grey | Pale grey | White | Black |
| IR image (negative) | Black | Mostly very dark | Grey | White | White |
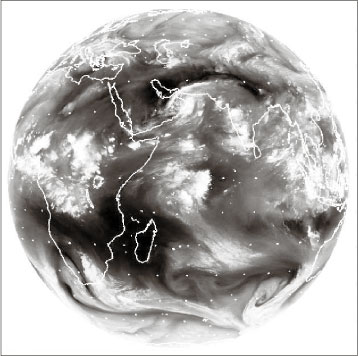
The water vapour in the air, as well as the droplets from which clouds are formed, absorbs radiation particularly effectively over a range of frequencies that lie within the infrared part of the electromagnetic spectrum. By looking at the detail of the IR spectrum passing through the atmosphere to a satellite, and by comparing absorption at individual frequencies, it is possible to make a good estimate of the total amount of water and water vapour along any line between a point on the surface of the Earth and the satellite. Most of the water is in the lowest 10 km or so of the atmosphere. Figure 11 shows a 'water vapour image' for the same time as Figure 9, with increasing brightness corresponding to higher water vapour content and darkness indicating dryness.
What is shown in the water vapour image of Figure 11 at locations where the IR image of Figure 9a shows thick cloud cover? (Hint: look particularly at central and southern Africa.)
Figure 11 shows large quantities of water vapour over the regions where cloud cover can also be deduced from the IR image.
What is shown in the water vapour image, Figure 11, where the IR image, Figure 9a, shows little or no cloud cover? (Hint: look at the central Indian Ocean.)
The water vapour image also detects diffuse regions of moist air between the bright, thick cloud regions of the IR image.
As a result of absorption and emission of radiation at other IR frequencies, often by carbon dioxide gas, it is also possible for scientists to measure temperatures within the atmosphere, not just at the cloud tops. This is done by a careful calculation of the amount of IR radiation expected to be seen at a whole series of frequencies for a particular distribution of temperatures all the way along the line of sight. That distribution of temperatures is then adjusted until the IR spectrum predicted from it matches the one observed by the satellite, to within a reasonable tolerance. This laborious calculation is repeated for every point where the satellite makes an observation. Measuring a quantity of real interest (e.g. temperature) using a remote measurement of another quantity (e.g. IR radiation at various frequencies) can be challenging, but is vital across a range of scientific disciplines ranging from studies of the Earth's core via earthquakes to medical scanning of the human body.