

5.3.6 The SERAS process
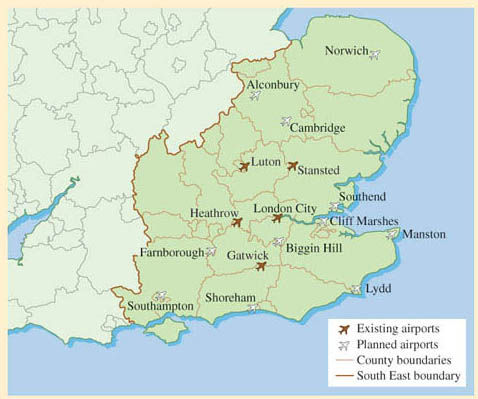
The specific aim of the SERAS process was to examine the various airport expansion options for the South East over the next 30 years. Figure 22 shows the location of the existing and proposed airports in the South East of England.
Each site was assessed according to the following three categories:
- no development beyond that already envisaged in the land-use planning system
- development of airport terminal capacity to make full use of existing runway capacity
- development of additional runway and terminal capacity.
Another significant component of the framework was that any airport development had to be seen to be funded by the private sector, so the interests shown by businesses were going to play a major role in influencing the location of the expansion.
The framework was implemented in five stages within SERAS:
- a search for sites (Stage 0)
- a selection of various site combinations to accommodate the various capacity forecasts (Stage 1)
- an appraisal of the options (Stage 2)
- more detailed studies on the most promising options (Stage 3)
- and finally, the making of a case for the most favourable options (Stage 4).
The aim of Stage 0 was not only to look for expansion of capacity within existing airports, but also to look for new sites within the South East which could accommodate a major new airport. Expansion on the existing airports was seen to be increasingly problematic due to the high surrounding population densities (chiefly Heathrow) and the repeated promises that no further expansion would occur after several major developments in the 1980s and 1990s.
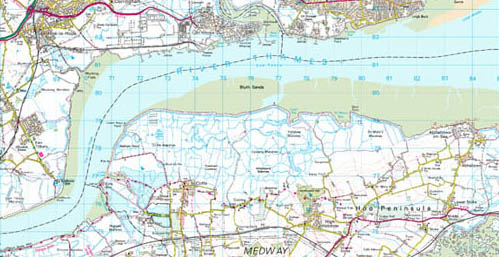
The most promising new site was identified at Cliffe in North Kent, which was proposed as a major international ‘hub’ airport with a total of four runways, compared to Heathrow’s two. This would provide a significant amount of capacity in an area with very low population density. The site would be situated on a marsh on the edge of the Thames estuary and would involve construction over several nature reserves.
Stage 1 then went on to identify the feasibility of development on existing and new sites. This analysed the sites on an individual basis, while Stage 2 went on to combine the various sites so as to identify the options with the lowest cost-benefit ratio.
In Stage 3, the most promising options were selected for further analysis. An attempt was made to first identify the level of environmental impact, and then to quantify the environmental costs of expansion. These included a consideration of the effect of noise, local air quality and global warming and how these could be ‘paid for’ by increasing air fares. Other factors considered in Stage 3 included surface transport, safety, land-and property-take, heritage, ecology, landscape, urbanisation and employment. This resulted in revisions to runway layouts, supporting infrastructure and recalculation of expected capacity for the various options.
The SERAS framework made no attempt to balance the environmental and economic impacts, or find a compromise between the various stakeholders at national and local level. Its aim was to reveal the objective ‘facts’ on airport expansion within the South East of England, and for these to be assessed in a regional consultation, and eventually, by government ministers.
Table 2 shows the resulting cost–benefit analysis for the various options. (The ‘cost–benefit analysis’ technique is explained in the pdf below.)
‘Cost-benefit analysis’ technique [Tip: hold Ctrl and click a link to open it in a new tab. (Hide tip)]
| Proposed extra runways with planned year of completion | Total South East capacity in 2030 (millions of passenger per annum) | Total benefits (£ billion) | Costs (£ billion) | Net benefits (£ billion) |
|---|---|---|---|---|
| Maximum use of existing runways | 202 | 6.7 | 1.8 | 4.9 |
| Gatwick (one close parallel – 2011)* | 217 | 8.6 | 2.8 | 5.9 |
| Gatwick (one close parallel – 2024)* | 217 | 8.2 | 2.3 | 5.9 |
| Heathrow (one – 2011) | 229 | 12.0 | 4.2 | 7.8 |
| Gatwick (one new wide-spaced – 2011)* | 238 | 11.1 | 4.1 | 7.0 |
| Gatwick (one new wide-spaced – 2024)* | 238 | 9.8 | 3.0 | 6.8 |
| Heathrow (one – 2011) & Gatwick (one – 2021) | 240 | 14.6 | 4.8 | 9.8 |
| Heathrow (one – 2011) & Gatwick (one – 2024) | 240 | 14.5 | 4.8 | 9.8 |
| Stansted (one – 2011) | 249 | 11.0 | 3.9 | 7.1 |
| Gatwick (one – 2011) & Stansted (one – 2021) | 261 | 13.7 | 3.9 | 9.8 |
| Stansted (one – 2011) & Gatwick (one – 2024) | 261 | 13.8 | 4.0 | 9.8 |
| Stansted (two – 2011 & 2021) | 269 | 14.1 | 4.6 | 9.5 |
| Gatwick (two – 2011 & 2021) | 270 | 16.1 | 4.5 | 11.6 |
| Gatwick (two – both 2024) | 270 | 14.2 | 3.6 | 10.7 |
| Heathrow (one – 2011) & Stansted (one – 2021) | 276 | 17.8 | 5.5 | 12.3 |
| Heathrow (one – 2011), Gatwick (one – 2018) & Stansted (one – 2024) | 291 | 21.0 | 6.1 | 15.0 |
| Heathrow (one – 2011), Stansted (one – 2018) & Gatwick (one – 2024) | 291 | 21.3 | 6.2 | 15.1 |
| Stansted (two – 2011 & 2018) & Gatwick (one – 2024) | 294 | 17.4 | 5.2 | 12.2 |
| Gatwick (two – 2011/2018) & Stansted (one – 2024) | 294 | 22.6 | 5.7 | 16.9 |
| Heathrow (one – 2011) & Gatwick (two – 2018/2024) | 296 | 25.3 | 6.9 | 18.3 |
| Heathrow (one – 2011) & Stansted (two – 2018/2024) | 296 | 20.9 | 6.2 | 14.7 |
| Heathrow (one – 2011) & Gatwick (two – both 2024) | 297 | 22.6 | 5.9 | 16.6 |
| Gatwick (one – 2011) & Stansted (two – 2018/2024) | 297 | 16.9 | 4.8 | 12.1 |
| Stansted (one – 2011) & Gatwick (two – both 2024) | 314 | 21.7 | 5.7 | 16.0 |
| Stansted (three – 2011/2018/2024) | 314 | 17.8 | 5.2 | 12.6 |
| Cliffe (4 runways – 2011/2021) | 315 | 17.3 | 8.8 | 8.5 |
Footnotes
* A parallel runway close to the existing runway at Gatwick would be significantly smaller than a new wide-spaced runway built further away.The central objective of SERAS was to provide a robust financial appraisal of various expansion options that would ultimately allow a monetary comparison and a decision on the most cost-effective option. Economic and financial appraisal was conducted over the period to 2030, so that the effect of increasing airport capacity could be assessed year by year over the life of the new infrastructure.
In order to compare options, a number of assumptions were made about how each new runway scheme might be taken forward. Outline layout plans were produced for terminal and other facilities as well as an assessment of the road and rail infrastructure needed to support the airport development. A date for the opening of each runway was assumed. The capacity of different airport options was estimated and forecasts produced of how many passengers would use the new facilities. This enabled an estimation of the cost of construction and a measure of the impacts on people and the environment. For example, meeting the costs of carbon dioxide emissions would increase the costs within the cost–benefit analysis by about £1 billion (Cliffe), £1.5 billion (Stansted, three runways) and £2.5 billion (Heathrow, one runway, and Stansted, two runways).
The SERAS study also used the Federal Aviation Administration methodology for calculating the economic benefits of aviation expansion. Direct impacts were estimated by assessing the increased economic activity occurring at the airport such as the increase in employment and sales of merchandise. Indirect impacts were estimated by looking at the expansion of industries and businesses which contribute directly to the airport’s operation (e.g. hotels servicing airline pilots and stewards, aircraft maintenance, airline catering, etc.). Finally, induced impacts were estimated by assessing the effects of the ‘chain reaction’ as the cash injection resulting from the direct and indirect impacts stimulates the general economic activity. One can imagine the difficulties in quantifying these benefits, especially when attempting to make predictions several decades into the future. Once again, many of the same assumptions used to calculate an increase in passenger numbers in the SPASM simulation were also used here to estimate the economic benefits of airport expansion. Note that the predicted capacity requirement in the South East by 2030 was 300 million passengers per annum, i.e. SPASM assumptions included no options for redistributing capacity to other UK airports.
The original SERAS study did not include Gatwick airport. In 1979, the then state controlled British Airports Authority (now BAA PLC) came to an agreement with West Sussex County Council to not build another airport runway before 2019. Thus the original SERAS study omitted Gatwick on the grounds that the probability of expansion there was very low. This assumption was challenged by the county councils within which the Stansted and Cliffe expansion options are situated, and they took the DfT to court. In November 2002, the court judge made the ruling that options for expansion at Gatwick airport should not be excluded from the process.
Activity 22 Comparing qualitative and quantitative assessment of impact
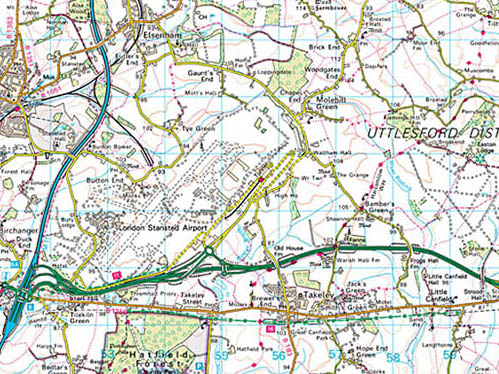
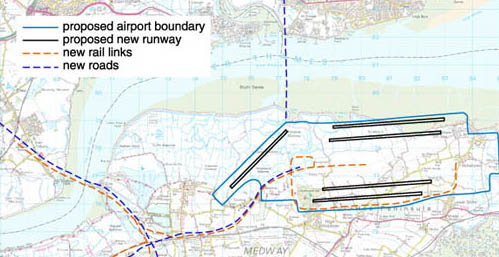
As a practical illustration of the non-quantifiable components of the SERAS analysis, I would like you to focus on two contrasting options. The first is Stansted, which already has one runway and, with its existing infrastructure, has the potential to handle up to 25 million passengers per year. Cliffe, on the other hand, is a totally new site with the need to construct everything – from runways to terminals to the supporting transport network – from scratch.
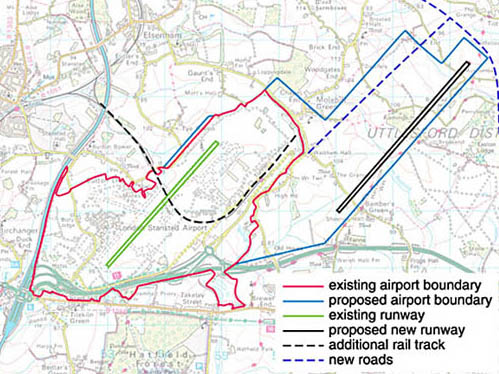
Below you will see two OS maps, one of the Stansted region and one of the Cliffe region. On the right of each image you will see the planned runway developments, including the land-take (one runway for Stansted; two runways at Cliffe by 2015 and a further two by 2030). Data is also provided on the impact on the ecology, heritage, noise, water, air quality and employment.
Compare the data on the two sites for development by 2015 (i.e. one new runway for Stansted and two new runways at Cliffe). Consider how important these various qualitatively-assessed impacts are to you, and provide a rating from low to medium to high impact for each of the two sites. (You may find this easier if you draw a table.) What criteria did you use to make these evaluations? What difficulties has this exercise presented to you?
Taking into account all the impacts in your table, and the relevant cost–benefit analysis and the envisaged total capacity by 2030, which of these two sites would you choose for development?
Stansted region
Impacts on people and the environment
Land and Property
Construction of the airport would result in the following:
- the area of the airport would increase from 9.5 km2 today to 16.5 km2 (one runway) 19 km2 (two runways) or 22 km2 (three runways)
- just over 100 (one runway) or 200 (two/three runways) residential properties would need to be physically taken
- 700 ha (one runway) or 1200 ha (two/three runways) of high grade agricultural land would be lost
- encroachment onto 457 ha (one runway), 683 ha (two runways) or 747 ha (three runways) of the Stansted Airport Countryside Protection Zone.
Heritage
Two Scheduled Ancient Monuments – the site of Waltham Manor and The Grange – are lost in all three options.
A third – the site of the medieval Takeley Priory at Warish Hall – might be lost in the three runway option.
One Grade II* listed building is lost in the two and three new runway options.
A number of Grade II listed buildings are lost in each option as follows: 29 (one new runway); 50 (two new runways); or 64 (three new runways).
Ecology
The two or three runway options would result in the loss of about half of the Elsenham Wood SSSI.
Water
All options require engineering work, diverting or culverting, to several rivers. The Environment Agency is generally opposed to culverting and such works are seen as a significant impact.
The extra passengers associated with additional runways add to the demand for water which may be difficult to meet, even with supply and demand management and water saving technology.
Daytime Noise
Tables 3 and 4 (below) show the areas and numbers of people exposed to different amounts of aircraft noise based on an average 16 hour day (0700-2300).
| Size of area affected (Km2) | ||||||||
|---|---|---|---|---|---|---|---|---|
| 2000 | 2015 | 2030 | ||||||
| Level of Noise Leq(dBA) | Base Case | Maximum Use | 1 new runway | Maximum use | 1 new runway | 2 new runways | 3 new runways | |
| >54 | 92 | 46 | 74 | 127 | 87 | 214 | 326 | 393 |
| >57 | 53 | 28 | 43 | 79 | 50 | 127 | 191 | 228 |
| >60 | 33 | 16 | 25 | 42 | 30 | 76 | 111 | 136 |
| >63 | 20 | 10 | 15 | 23 | 18 | 40 | 63 | 78 |
| >66 | 13 | 5 | 9 | 13 | 10 | 23 | 35 | 42 |
| >69 | 8 | 3 | 5 | 7 | 6 | 13 | 20 | 25 |
| >72 | 4 | 2 | 3 | 4 | 3 | 7 | 12 | 15 |
| Numbers of people affected ('000s) | ||||||||
|---|---|---|---|---|---|---|---|---|
| 2000 | 2015 | 2030 | ||||||
| Level of Noise Leq(dBA) | Base Case | Maximum Use | 1 new runway | Maximum use | 1 new runway | 2 new runways | 3 new runways | |
| >54 | 13 | 5 | 9 | 15 | 12 | 27 | 42 | 50 |
| >57 | 6 | 2 | 5 | 8 | 6 | 14 | 24 | 28 |
| >60 | 2 | 1 | 2 | 4 | 2 | 7 | 10 | 14 |
| >63 | 1 | 0.3 | 0.8 | 3 | 1 | 4 | 6 | 7 |
| >66 | 0.5 | 0.1 | 0.3 | 2 | 0.3 | 3 | 3 | 4 |
| >69 | 0.2 | 0.1 | 0.4 | 0.2 | 2 | 2 | 3 | |
| >72 | 0.1 | 0.4 | 0.7 | 2 | ||||
Air Quality
Population exposed to an exceedance of EU limits:
- PM10 – nil
- NO2 – there are estimated to be small numbers of people exposed to an exceedance of NO2 – just over 300 by 2030 in the largest option (with three new runways) and about 20 by 2015 with one new runway. It is likely that such impacts could in practice be prevented.
Employment
| Forecast of employment ('000s) | |||||||
|---|---|---|---|---|---|---|---|
| 1998 | 2015 | 2030 | |||||
| Maximum Use | 1 new runway | Maximum use | 1 new runway | 2 new runways | 3 new runways | ||
| Direct on-site | 7 | 12 | 39 | 12 | 37 | 48 | 61 |
| Direct off-site | 1 | 2 | 7 | 2 | 6 | 9 | 11 |
| Indirect | 2 | 5 | 14 | 4 | 13 | 17 | 21 |
| Total | 10 | 20 | 60 | 18 | 56 | 74 | 93 |
Table 5 shows that the employment generated by the airport in 1998 was around 10,000 jobs. The runway options appraised could increase these totals to around 60,000 jobs by 2015 and between 57,000 and 93,000 jobs by 2030.
The current core catchment area is Uttlesford, East Hertfordshire and Harlow districts. A wider catchment area, potentially embracing Braintree, Chelmsford, Harlow, Broxbourne, Epping Forest and North East London would need to be considered for the larger options.
The potential employment growth is large in relation to the Government's projections of total employment growth in the core and wider catchment areas (of 45,000 jobs to 2015 and 74,000 jobs to 2030). RPG provision, projected forward, could result in an additional 83,000 houses in the core and wider catchment area to 2030.
Meeting the additional labour demand associated with new runways would require a sectoral shift in current employment patterns (from the low base of 5 per cent of current core catchment area jobs being at the airport), attracting some employees from more distant areas (in the Lea Valley, for example) and additional development, requiring a change in current planning policies.
Cliffe region
Impacts on people and the environment
Land and Property
Construction of the airport would result in the following:
- the airport would cover a total of about 26 km2 (including extensive cargo and maintenance facilities)
- around 1100 residential properties, some of which are holiday homes, would need to be physically taken (half a dozen more with the crosswind runway)
- around 2000 ha of agricultural land would be lost (2200 ha with the crosswind runway).
Heritage
Based on the layout of the new airport developed for SERAS, one Grade 1 – the Church of All Saints at Allhallows – one Grade II* and seven Grade II (eight if the crosswind runway is also built) listed buildings would be lost.
Ecology
A new airport at Cliffe would impact on several nationally and internationally designated areas, notably the Thames Estuary and Marshes Special Protection Area (SPA) and the Northward Hill Site of Special Scientific Interest (SSSI)/National Nature Reserve.
The Thames Estuary and Marshes SPA and Ramsar site (of very high ecological value) is a site of international importance for birds, flora and fauna and is given protection laid out in the EC Habitats Directive. Any potentially adverse effect to that site would require the Government to demonstrate that it has considered all reasonable alternatives and that compensatory measures will be carried forward to prevent an overall loss of habitat and bird numbers. One possibility could be land purchase and habitat creation elsewhere in Kent. Potential sites have been considered and discussed with the Department for Environment, Food and Rural Affairs and English Nature. Preliminary cost estimates are in the order of £200 million.
The presence of large bird populations raises the risk of birds colliding with aircraft which is an important safety issue for any airport. A preliminary assessment was made of this risk at Cliffe. The consultants noted the potentially significant hazards of the Cliffe location and identified some options for mitigating the risks in the design and layout of the airport and in measures in the surrounding area. They acknowledge that further research would be needed to assess fully both the risk and the best mitigating measures. The Department will be commissioning work during the consultation period.
Water
Options at Cliffe generate High Adverse impacts against all the water objectives, except groundwater.
The topography of the site requires a level platform area to be created on up to 15 metres of fill over the low lying marshes. A number of marshes and creeks would effectively be destroyed.
While the raised airport platform will solve any flooding problems in the airport itself, it is likely to increase the risk of flooding elsewhere on the peninsula.
The extra passengers associated with a new airport would add to the demand for water which may be difficult to meet, even with supply and demand management and water saving technology.
Daytime Noise
| Size of area affected (Km2) | ||
|---|---|---|
| Level of Noise Leq (dBA) | 2015 (2 runways) | 2030 (4 runways) |
| >54 | 79 | 176 |
| >57 | 57 | 111 |
| >60 | 44 | 75 |
| >63 | 25 | 56 |
| >66 | 14 | 38 |
| >69 | 7 | 20 |
| >72 | 4 | 11 |
| Numbers of people affected ('000s) | ||
|---|---|---|
| Level of Noise Leq (dBA) | 2015 (2 runways) | 2030 (4 runways) |
| >54 | 11 | 32 |
| >57 | 4 | 14 |
| >60 | 3 | 9 |
| >63 | 1 | 5 |
| >66 | 0.3 | 3 |
| >69 | 0.2 | 0.4 |
| >72 | ||
Air Quality
No population is forecast to be exposed to exceedances of EU limits for either NO2 or PM10.
Employment
| Forecast of employment ('000s) | |||||||
|---|---|---|---|---|---|---|---|
| 2015 2 runways | 2030 3 runways | ||||||
| Direct on-site | 35 | 52 | |||||
| Direct off-site | 6 | 9 | |||||
| Indirect | 12 | 18 | |||||
| Total | 53 | 79 | |||||
The core labour catchment area for a new airport at Cliffe is taken to include boroughs on both sides of the Thames estuary: Medway Towns, Gravesham and Dartford in Kent and Thurrock, Castle Point, Southend-on-Sea, Basildon and Rochford in Essex. This area currently provides around 100,000 more workers than jobs.
A large airport at Cliffe will provide a large number of jobs across the skill spectrum in a regional and national priority area for regeneration and in close proximity to a labour force where unemployment and out-commuting rates are high.
Discussion
This activity asks for your own assessment of these impacts, so my response may well be different from yours.
| Stansted – one new runway | Cliffe – two runways | |
|---|---|---|
| Noise | high impact | medium |
| Land/heritage | high | medium |
| Ecology | medium | high |
| Local air quality | medium | low |
| Water | high | high |
| Employment | medium | high |
The criteria I used differed for the various impacts. For noise and local air quality it was the total number of people affected; for land/heritage it was the number of historical buildings destroyed (I assumed residential buildings had low historical value); for ecology it was the rarity of the habitats (wetlands are critically endangered habitats); for water it was the scale of disruption; and for employment it was the number of people gaining employment.
The difficulty I found was the lack of information: for example, how was noise impact assessed? Personally, I would find evening noise significantly more annoying than at other times of day but the pattern through the day was not known.
The net benefit of Stansted (one runway) is £7.1 billion, providing 249 million passengers per annum capacity. For Cliffe (four runways) the figures are £8.5 billion and 315 million passengers. (For Cliffe there is a difficulty in comparing the quantitative data with the qualitative assessment because official documents only provide data for four runways.) Taking all of this into account, I would choose Cliffe because of the lower impact on noise, land and air quality combined with the better local employment opportunities and the greater passenger capacity. Having said that, I recognise I have a strong bias towards the human and social impacts rather than the ecological ones.