5.4 Inspiratory drive
The supply of oxygen to tissues such as the heart, liver and WAT is, under euthermic conditions, invariably linked to and dependent upon local blood flow and pulmonary function. However, as we have already seen, under conditions in which blood flow is reduced to a trickle, the control of energy supply switches to local adaptations in the capillaries and tissue cells, including the oxygen affinity of erythrocyte haemoglobin, the supply and metabolism of respiratory fuels and the rate of protein synthesis. In contrast to the highly regulated phenomena of hypothermia and bradymetabolism, regulation of lung function is passive and follows directly from the primary regulation of T b.
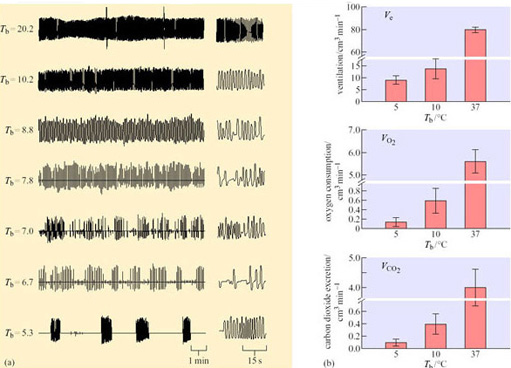
Artificially induced hypothermia to mimic hibernation (Figure 31) is elegantly illustrated in the golden-mantled ground squirrel (Spermophilus lateralis) (Zimmer and Milson, 2002). On entry to a torpor bout, the normal regular pattern of breathing becomes episodic with periods of around 25 breaths being followed by up to 30 minutes of apnoea (Figure 31a). Although breathing frequency becomes lower and periods of apnoea lengthen, the basic pattern persists into steady state-hibernation from a T b of 20.2° C down to 5.3° C. Thereafter, as T a decreases and T b falls below 6° C during hibernation, the episodic pattern converts to one of slow, evenly spaced single breaths. Cooling is induced in euthermic squirrels using a combination of two anaesthetics which increase thermal conductance and suppress NST. The animals are cooled whilst anaesthetic levels are reduced and then withdrawn as T a reaches 10.2° C.
Severe hypothermia reproduced the patterns of breathing seen on entry to hibernation with a fall in oxygen consumption and carbon dioxide excretion to around 0.2% of their euthermic levels (Figure 31b). These changes were reflected in a similar reduction in heart rate, suggesting that hypothermia triggers changes in both the cardiovascular and inspiratory control centres of the brain. In hibernation, however, respiratory responses to reduced circulating levels of oxygen (hypoxia) and increased carbon dioxide (hypercapnia) are still evident, whilst in induced hypothermia, only the latter is present. These data indicate that the ability to sense tissue oxygen levels in hibernation is regulated independently ofT b.