

5.3 Heat production
There are two graphs in this section, Figure 2 and Figure 3. Graphs are often used to display data in a way that makes trends easier to see than in a table. Simple graphs have two axes, one running horizontally across the page, and the other vertically up the page. They are labelled in the same way as the column headings of a table (see Section 5.2) and the data points are then plotted. The text here talks you through that process. You will also notice the use of a type of scientific 'shorthand' in this section, where letters are used to represent words. The italic letter T is often used to represent 'temperature'. Here both the temperature inside an animal's body and the temperature of the surroundings are measured, so we need to identify which temperature we are referring to. This is done by adding an appropriate letter, usually subscripted and not italicised, immediately after the T. So here Tb stands for the body temperature of the animal and Ta for the surrounding, or ambient, temperature. When you see the shorthand version, try to translate it in your head into its real meaning, so I would read Tb as 'body temperature' rather than as 'tee-little-b'.
The high rates of metabolism in mammals (and birds) mean that relatively large amounts of heat are produced as a by-product. But you'll appreciate that this heat is not wasted; it's used in these animals to warm the body. The fact that a mammal (or bird) keeps its body temperature at a high level (37 °C - degrees Celsius - for humans) ensures that metabolism proceeds at a high and efficient rate, allowing the sustained and elevated pace of life typical of mammals. Animals that depend on internally generated heat (i.e. metabolic heat) to maintain their body temperature are called endotherms. By contrast, ectotherms have a body temperature influenced most sharply by heat from external sources, i.e. from the immediate environment.
Suppose an ectotherm - say a small lizard - is placed in a small container in which the air temperature can be varied (a useful alternative term for the temperature 'outside' is ambient temperature, Ta). The temperature of the animal's body (Tb) can be measured while we change Ta, via a miniature temperature-measuring probe into the animal's cloaca (the common opening for the gut and the urinogenital system). We could start with a comfortable ambient temperature (comfortable for a lizard, that is), say about 38 °C, record the animal's body temperature, lower the ambient temperature to 30 °C and then measure the body temperature once more, after allowing the animal to settle down over a couple of hours in the changed conditions.
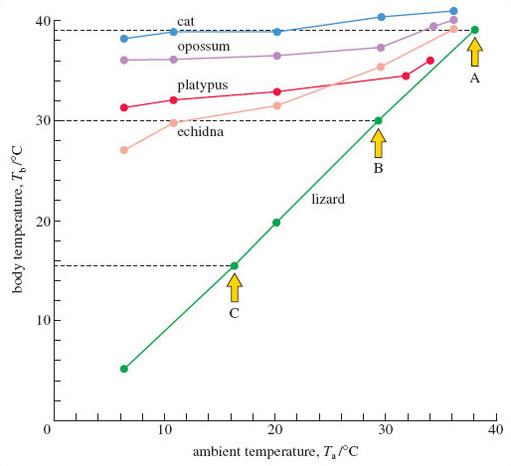
Figure 2 shows the type of results we'd get. Concentrate for the moment on the data for the lizard. In this graph, the line labelled 'ambient temperature' is referred to as the horizontal axis; that labelled 'body temperature' is the vertical axis. For a particular Ta, say 38 °C, there's a corresponding measure of the lizard's Tb - in this instance, it was 39 °C, which you can check by following the horizontal dashed line across to the vertical axis. The plotted value is identified by arrow A on Figure 2. At a Ta of 30 °C, the lizard's Tb was identical, 30 °C, as plotted on Figure 2 and identified by arrow B. For a Ta of 16 °C, the value of Tb was 15.5 °C; this point (shown by arrow C) is plotted in an appropriate position between the 10 °C and 20 °C points marked on the axes - working out where to place the point is a lot easier to do if you use graph paper. When the full range of 'lizard' values is plotted, a line is drawn between them - the lowest plotted values of Ta and Tb are 6 °C and 5 °C respectively.
The same procedure can be repeated for a placental mammal, such as the cat. Look at the cat data in Figure 2 and check that you follow the plotted points; for example, at a Ta of 10 °C, Tb is 39 °C. Joining all the plotted points gives a more flattened but somewhat 'jagged' line over the measured range of ambient temperatures.
Question 7
What's the most striking difference between the way in which the cat and the lizard respond to changes of ambient temperature?
Answer
The body temperature of the cat stays much the same when the ambient temperature falls. But in the lizard, the body temperature falls as ambient temperature drops.
So, the endothermic cat is able to maintain its body temperature - at a high and constant temperature (of about 39 °C), whereas in these conditions, the lizard has seemingly little option but to allow its body temperature to conform to that of its environment. As is typical of mammals, the cat is regulating its body temperature - more technically it is demonstrating thermoregulation. On this evidence, the lizard is a conformer - body and ambient temperature change in step. But an ability to thermoregulate is not unique to mammals; birds do so very proficiently and even some fish (such the tuna mentioned earlier) and a few insects do so, in a rather elementary fashion. You'll notice from Figure 2 that monotremes (and the marsupial representative - the opossum) are also able to thermoregulate, though less precisely than the cat.
But now suppose the body temperature of the ectotherm is recorded under sunny natural conditions, with the animal able to display its normal behaviour. Many lizards then have a body temperature considerably above that of the surrounding air, because of an ability I mentioned before - they are able to bask in the sunshine. A modest-sized lizard - for example the common European lizard - in sunny conditions, can warm from 15 °C (close to the recorded air temperature) to 25 °C in about five minutes by basking side-on to the sun. By shuttling into the sun and back into the shade, this lizard can maintain a relatively even body temperature close to 30 °C, at least during the sunnier months of the year and during the day (Tb falls at night or on sunless days). So here thermoregulation is achievable by behavioural means.
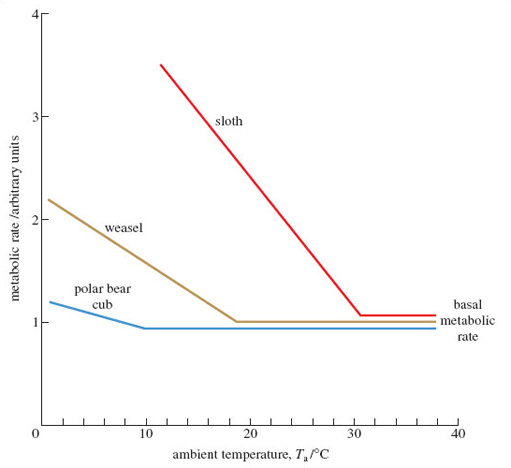
By contrast, in mammals (and birds) thermoregulation can be achieved largely by physiological means - by internal adjustments within the body's tissues and organs. Adjustments in metabolic rate are an especially important part of the process. Figure 3 helps to explain what's involved; for the moment, concentrate on the line labelled 'weasel' - which, for convenience, we can think of as a typical temperate mammal. Here, the vertical axis denotes metabolic rate; this quantity can be measured in a variety of ways - often by measuring how much heat is generated by the animal in resting conditions. Like all such scientific measurements, agreed units would normally be used to express such data, but explaining the 'what and why' we'd use here isn't crucial to our argument, so the vertical axis is labelled simply 'arbitrary units'. The horizontal axis is Ta, just as in Figure 2.
Question 8
What's striking about the metabolic rate for the weasel between the ambient temperatures of 38 °C and 19 °C?
Answer
It's constant, at what seems like the lowest possible value. Between these temperatures, there would be no change, therefore, in the amount of heat produced as a by-product of metabolism.
This minimum rate of metabolism is termed the basal metabolic rate (BMR); it would be the 'at rest' values recorded for the mammals in Table 1.
Question 9
Describe what happens when the ambient temperature experienced by the weasel falls below 19 °C.
Answer
The metabolic rate increases steadily, which means that the amount of metabolic heat produced also increases. (The fact that it's a straight line means that the metabolic rate increases by the same amount for a standard drop of ambient temperature, of say 5 or 10 °C.)
Question 10
Why might this boost in metabolic heat production be important?
Answer
When conditions become increasingly colder, the animal is likely to lose a greater amount of heat than it would in warmer temperatures. The extra heat production, therefore, might compensate for this increased loss, which helps explain why body temperature stays at a constant value in the way that we saw for the cat in Figure 2.
The type of elevation of metabolic rate we see in Figure 3 is termed a thermogenic response and is one of the most important distinguishing features of mammals (and of birds too). The type and scale of the thermogenic response varies; I can use the axes on Figure 3 to show the type of plot obtained from comparable measurements on mammals living in very different environments. When the metabolic rate in a tropical mammal like a sloth is measured against Ta, the BMR is evident over a much narrower range of Ta, and the rate of metabolism increases very sharply below about 31 °C.
Question 11
Using the correct technical terms and symbols, explain the way in which metabolism in the arctic mammal changes as ambient temperature drops.
Answer
As Ta falls, the BMR is maintained down to a Ta of about 10 °C, at which point metabolism increases comparatively slowly as Ta drops further.
The slopes of the three lines in Figure 3 differ. The steepest such slopes are typical of tropical mammals, especially those that are unlikely to encounter low temperatures. They lose heat relatively rapidly from their surface and their metabolism has to be cranked up very substantially to compensate. By contrast, mammals adjusted to very cold conditions (the polar bear cub or the arctic fox you saw in LoM) are much more proficient at conserving the heat they produce, largely because of their superb insulation. The arctic fox can maintain its BMR down to a Ta as low as minus 30 °C, i.e. −30 °C; the tropical forest-dwelling sloth is obliged to raise its metabolism at any Ta below 30 °C.
How then do mammals raise their metabolic rate in the ways shown in Figure 3? Some behavioural tactics will be familiar to you. Increasing activity - the stamping of feet - reflects an increase in voluntary muscular activity; since the muscles are working harder, they produce more metabolic heat.
Another part of the explanation is shivering, where opposing sets of muscles contract in a high frequency mode. Rather than movement resulting - the usual effect of muscle contraction - these 'inefficient' tiny contractions produce large amounts of heat. Shivering can be temporarily blocked by drugs (notably curare, which prevents muscle contraction) but when such drugs are applied, they don't entirely remove the ability that animals have to increase metabolism in the cold. This suggests that there's another component to responses of the type evident in Figure 3. It's now known that many mammalian tissues (such as the liver of species used to living the cold) have the capacity to raise their metabolism and burn off more fuel in the mitochondria. If you work through the other units in the series, you will learn about a range of circumstances when 'turning on' heat production in this way is especially advantageous. But what's striking at this stage is that mammals well-suited to life in the cold have not just those visible adaptations 'on the surface', such as thick fur. They can display 'inner' adaptations - in their metabolism, for example - of the type that only measurements such as those in Figure 3 can reveal.