

1.7 Innovation and the S-curve
There are many theories of change, but one that is particularly relevant to innovation is centred on the S-curve. It is a way of depicting incremental, disruptive and radical innovation.
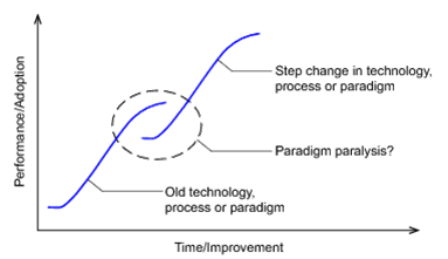
In Figure 5, the vertical axis shows the performance of the item under consideration – this is sometimes equated to competitive advantage for business organisations. The horizontal axis shows effort – this could be time, resource investment or similar, which is associated with the innovation and its development. The S-curve shows the innovation from its slow early beginnings as the technology or process is developed, to an acceleration phase (a steeper line) as it matures and, finally, to its stabilisation over time (the flattening curve), with corresponding increases in performance of the item or organisation using it. Over time, the technology reaches its technological limit of usefulness or competitive advantage. At any point, there may be a step change in the technology – a radical innovation – resulting in a new S-curve.
Disruptive innovation can involve some elements from the old technology ‘transferring’ across – hence the S-curve overlaps.
In radical innovation, the ‘gap’ or discontinuity shown in Figure 5 conveys the sense of a break from one technology to the other, newer, radical technology. Thus a radical technology fulfils the same need, but is based on a different knowledge and practice base. An example might be photographic film being largely replaced by digital storage media in digital cameras. Paradigm paralysis is when an organisation resists the shift to the new idea, process or product. One example is the Kodak photographic company, traditionally a hugely innovative company responsible for the invention of the digital camera, but which continued to prioritise its commitment to film and printing of images despite the digital revolution in camera and media technologies. This paradigm paralysis (continuing to support film), which is described in an article titled ‘The moment it all went wrong for Kodak’ in The Independent newspaper (Usborne, 2012), contributed to the bankruptcy and demise of the company in 2012.
The S-curve can also be used to depict the diffusion of innovations in a culture over time. First described by Everett Rogers in the early 1960s, diffusion is the process by which an innovation is communicated and taken up over time. Rogers’ work is important because it emphasises that the innovation itself is not the only determinant of its ‘success’. There must also be communication channels, time and a social system in place to enable the innovation to be used and adopted more and more widely. Rogers also identifies the different categories of adopters: innovators, early adopters, majority (further subdivided into early and late) and laggards (Rogers, 1962). Returning to the example of the solar panels, those households having solar panels by 2015 in the UK would probably still be classed as innovators or early adopters. The social system, comprising policy, legal, finance, information and many other factors, is still not (and may never be) fully in place for solar panels to be installed by the majority of householders.
While there are criticisms of S-curves and Rogers’ diffusion theory, they provide a useful way of understanding how innovation may or may not progress. However, you may be wondering why all this is important for environmental management. This is explored next.