

2.3 Inputs and outputs
An input–output model can show the inputs into an organisation, the transformation processes within the organisation using the inputs, and the outputs arising from the transformation process. A simple example might be the input of water into a car wash, the transformation of a dirty car into a clean car and the output of waste water probably containing various soaps, oils and dirt.
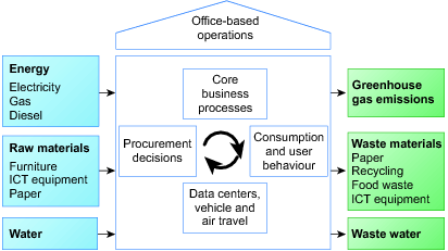
One example of an input–output diagram is shown in Figure 11. It is produced by the Australian National Audit Office as a guide for organisations auditing their environmental performance.
Figure 11 shows the organisation (in this case an office-based organisation) and some of its main areas of activity (e.g. procurement decisions, data centres). To the left of the organisation, some inputs are shown and to the right are various outputs.
Activity 21 Input–output model of an organisation
Draw a basic input–output model to explore some of the different environmental aspects related to the activities of an organisation familiar to you – you can use the same organisation used in earlier activities. Don’t worry too much about detail or technicalities.
Discussion
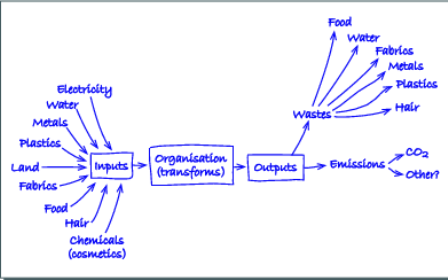
The diagram is for the hairdresser organisation explored in previous activities. The inputs are relatively straightforward based on the previous activities. It was surprising that the main outputs were a range of wastes and emissions – I expected to be able to identify a wider range of environmental outputs.
In terms of feedback, waste water could be linked back to water and land and food inputs (through various ‘paths’). Metals, plastics and fabrics could be recycled/reused and thus become part of the inputs. CO2 emissions could be linked back to water and also food and land, but could be connected to other inputs more indirectly.
Compiling an input–output diagram is not always straightforward as it often requires a certain amount of knowledge about the activities of an organisation. In some cases, you will be faced with uncertainty about any or all of the inputs, outputs and transformation processes or operations. In many cases, determining, assessing and measuring the varied inputs and outputs and the various pathways of feedback loops is problematic.
Even so, it should be evident that the environmental situation faced by an organisation is often not just limited to one aspect of the environment (e.g. water), nor singularly as just either an input or output. In terms of feedback, often the inputs are affected by the outputs – such as outputs of waste products getting into inputs of water, for example. Even if the organisation responsible for the output avoids this, it may affect individuals, other organisations and communities locally or internationally.
Your input–output model and some assessment of possible feedback loops should begin to reveal a more complex set of relationships between an organisation and its environment. In other words, you can begin to reflect on the systemic nature of many environmental situations faced by organisations, rather than a singular focus on just one aspect of an organisation’s operations.
The systemic nature of environmental issues has implications for the ways in which organisations approach environmental management and innovation. Not least is the notion that more complex environmental issues and situations require organisations and their members to be thinking and acting in more systemically innovative ways.