

Image bank
This is Watching the weather's image bank. If you want to return to the unit, please click here.
This is Watching the weather's image bank. If you want to return to the unit, please click here.
records 11 - 20 of 38
| image title | Radiosonde 1 |
| caption | Radiosondes are carried on balloons. They transmit by radio their position (using GPS), air temperature, humidity and pressure. The sensors are all electronic. \\\\*See also Radiosonde 2, MI035. |
| code | MI034 |
| Section | Meteorological instruments |
| Subsection | Balloons, aircraft and radar |
| image credit | © Vaisala |
| thumbnail | 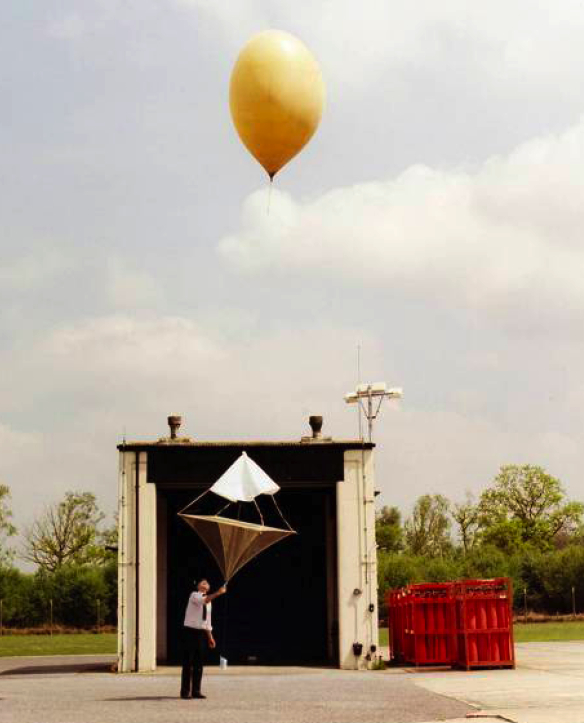 |
| File | |
| image title | Radiosonde 2 |
| caption | Radiosondes are so-named because they probe the atmosphere (the French word 'sonde' means probe) and radio information back to Earth. They are launched into the atmosphere on a balloon and normally rise right through the troposphere and into the stratosphere (about 25 to 30 km above the Earth's surface). Notice how big the balloon is in relation to the size of the payload. See also Radiosonde 1, MI034. |
| code | MI035 |
| Section | Meteorological instruments |
| Subsection | Balloons, aircraft and radar |
| image credit | British Antarctic Survey/Science Photo Library |
| thumbnail | 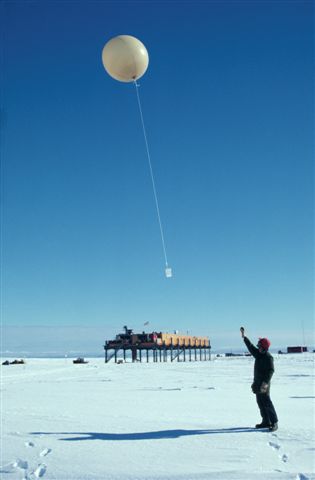 |
| File | |
| image title | Radiosonde 3 |
| caption | Radiosondes are carried on balloons. This image shows the payload, which uses GPS to record its position, and also measures air temperature, humidity and pressure by means of electronic sensors. The instrument readings are then transmitted by radio to a receiver on the ground. (The process of transmitting data to a remote location in this way is called telemetry.) |
| code | MI036 |
| Section | Meteorological instruments |
| Subsection | Balloons, aircraft and radar |
| image credit | © Vaisala |
| thumbnail | 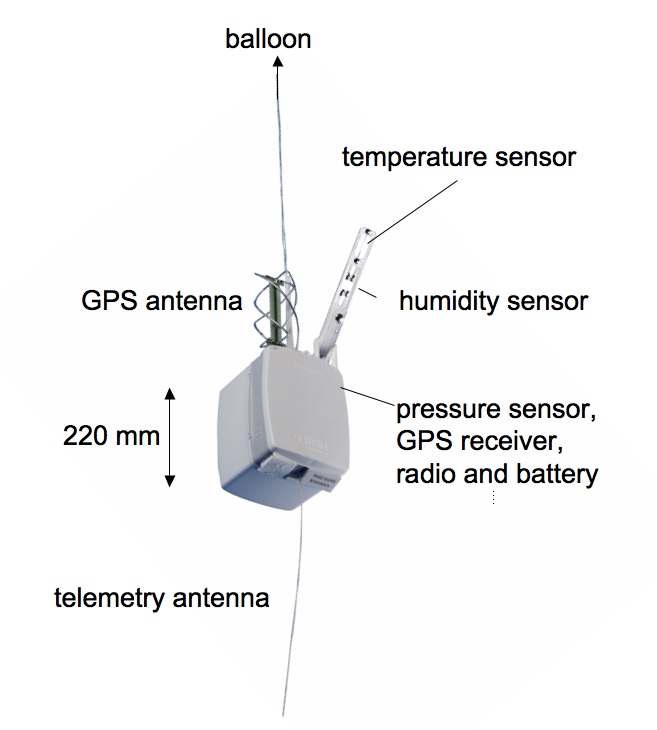 |
| File | |
| image title | Day-time infrared image from Aqua polar-orbiting satellite |
| caption | A mosaic of infrared images taken on the day-side of the Earth by the Atmospheric InfraRed Sounder (AIRS) from a polar-orbiting NASA satellite, Aqua, on 20 August 2007. Aqua has been placed in a 705 km altitude, 99 minute period orbit, which passes within 10° of the poles. On each orbit, the satellite crosses the Equator when the local time beneath it is 1:30pm on the day-side and 1:30am on the night side. A false colour image has been used to indicate temperatures, with the spectrum from violet to red corresponding to increasing temperature. (The key gives actual temperatures on the Kelvin scale; subtract 273.15 from these values to get the temperature in degrees Celsius.) All the images taken by the satellite during the day have been projected onto a regular latitude-longitude map. The continents are clearly visible and much warmer than the oceans. Each nearly vertical stripe which makes up the full image was taken on the day-side of the Earth on a successive orbit in the same 24- hour period. Each vertical stripe of the image was taken on the day-side of the Earth during each orbit. The date of the image was chosen to match the geostationary images from GOES East (MI025, 027, 029) for comparison; part of Hurricane Dean is seen in one stripe, but the day-side images do not quite overlap at low latitudes and so the rest of it is not seen. |
| code | MI032 |
| Section | Meteorological instruments |
| Subsection | Satellites |
| image credit | © NASA |
| thumbnail | 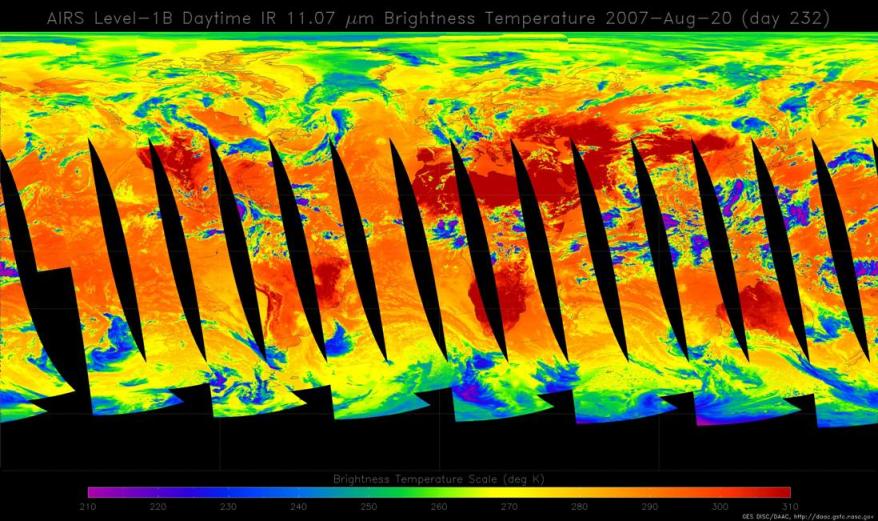 |
| File | |
| image title | Infrared image from Meteosat SEVIRI |
| caption | Greenwich Meridian, longitude 0°) at 1200 UTC on 2 May 2008. The outlines of countries are overlaid and there is also a grid of reference marks (+). Over the disk of the Earth, lighter colours have been used to indicate colder temperatures, as is conventional in IR images. In this image, in contrast to those in the S189 course book and others on this DVD, space around the Earth has been re-coloured black to produce a more natural looking image; space is, of course, the coldest, and not the hottest part of the image as the black colour might otherwise imply. The surface of north Africa, where it is mid-day, is the hottest (darkest) region visible and is clearly warmer than the oceans. Equatorial convective cloud-tops are high and therefore cold and coloured white. Mid-latitude cloud-tops tend to be a little lower and are a slightly darker grey. |
| code | MI021 |
| Section | Meteorological instruments |
| Subsection | Satellites |
| image credit | © 2007 EUMETSAT |
| thumbnail | 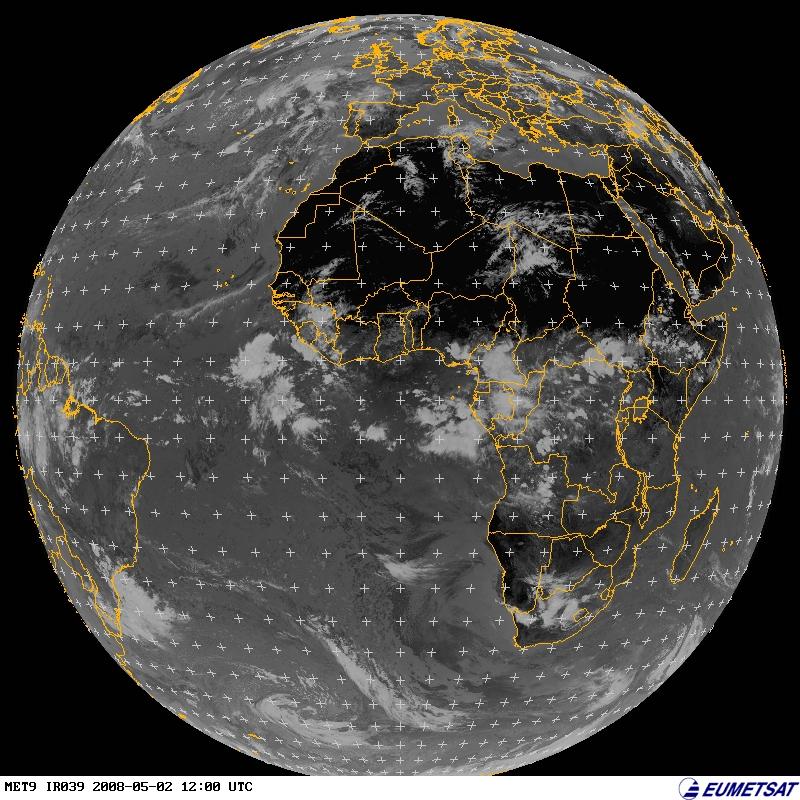 |
| File | |
| image title | Night-time infrared image from Aqua polar-orbiting satellite |
| caption | A mosaic of infrared images taken on the night-side of the Earth by the Atmospheric InfraRed Sounder (AIRS) from a polar orbiting NASA satellite, Aqua, on 20 August 2007. Aqua has been placed in a 705 km altitude, 99 minute period orbit, which passes within 10° of the poles. On each orbit, the satellite crosses the Equator when the local time beneath it is 1:30pm on the day-side and 1:30am on the night side. A false colour image has been used to indicate temperatures, with the spectrum from violet to red corresponding to increasing temperature. (The key gives actual temperatures on the Kelvin scale; subtract 273.15 from these values to get the temperature in degrees Celsius.) All the images have been projected onto a regular latitude-longitude map. The continents have been outlined, but you will need to enlarge the image in order to see them clearly. Each nearly vertical stripe which makes up the full image was taken on the night-side of the Earth on a successive orbit in the same 24- hour period. The date of the image was chosen to match the geostationary images from GOES East (MI025, 027, 029) for comparison; a different, and larger, part of Hurricane Dean is seen in the night-side orbits. |
| code | MI033 |
| Section | Meteorological instruments |
| Subsection | Satellites |
| image credit | © NASA |
| thumbnail | 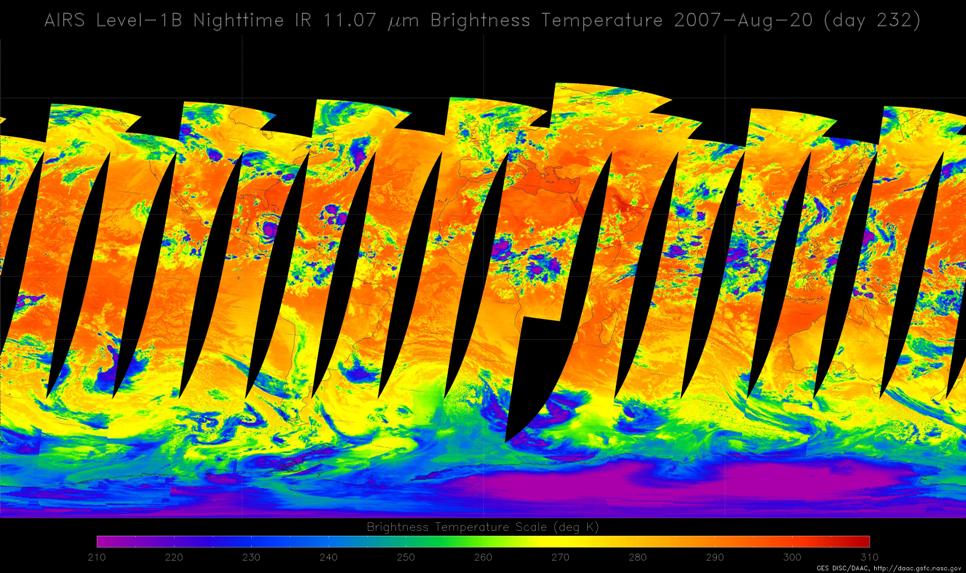 |
| File | |
| image title | Visible image from Aqua polar-orbiting satellite |
| caption | A mosaic of visible images taken by the Atmospheric InfraRed Sounder (AIRS) from a polar-orbiting NASA satellite, Aqua, on 20 August 2007. Aqua has been placed in a 705 km altitude, 99 minute period orbit, which passes within 10° of the poles. On each orbit, the satellite crosses the Equator when the local time beneath it is 1:30pm on the day-side and 1:30am on the night side. The images have been taken at several different frequencies to reconstruct an approximately natural colour image. All the images have been projected onto a regular latitude-longitude map and the continents are clearly visible. Each nearly vertical stripe which makes up the full image was taken on the day-side of the Earth on a successive orbit in the same 24-hour period. The date of the image was chosen to match the geostationary images from GOES East (MI025, 027, 029) for comparison; part of Hurricane Dean is seen in one stripe, but the visible images do not quite overlap at low latitudes and so the rest of it is not seen. On the other hand, high-latitude features are better resolved than in the geostationary satellite images. |
| code | MI031 |
| Section | Meteorological instruments |
| Subsection | Satellites |
| image credit | © NASA |
| thumbnail | 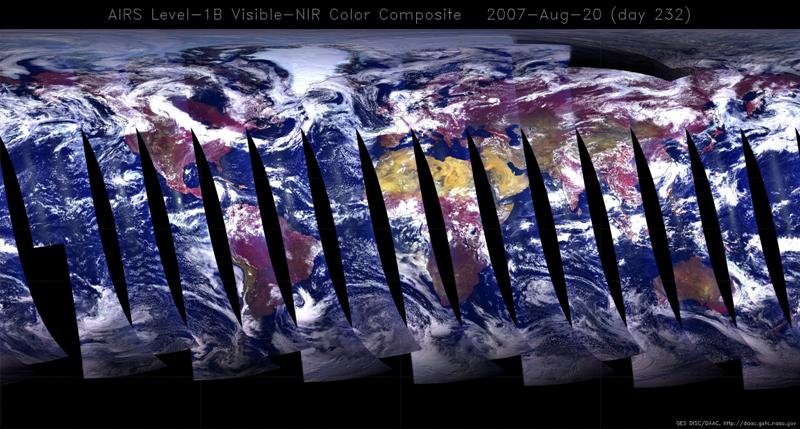 |
| File | |
| image title | Visible image from Meteosat SEVIRI |
| caption | A visible image taken from the geostationary satellite Meteosat SEVIRI (placed over the Greenwich Meridian, longitude 0°) at 1200 UTC on 2 May 2008. The outlines of countries are overlaid and there is also a grid of reference marks (+). This image is illuminated by sunlight and the brightness indicates the amount of light that has been scattered back to the satellite; clouds appear white and the oceans (where cloud-free) appear darker than the land. Strong convective cloud activity can be seen in equatorial regions, whereas at mid- and high latitudes clouds indicate the presence of large high- and low-pressure systems and frontal structures; a good example is a weather system over the South Atlantic. |
| code | MI019 |
| Section | Meteorological instruments |
| Subsection | Satellites |
| image credit | © 2007 EUMETSAT |
| thumbnail | 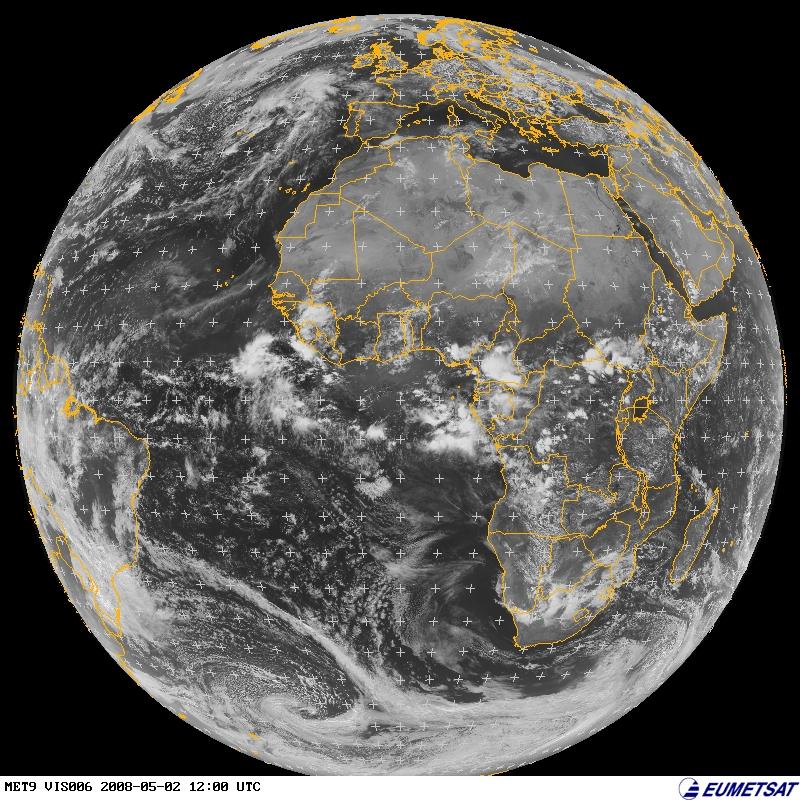 |
| File | |
| image title | Water vapour image from GOES East |
| caption | A water vapour image taken from the geostationary satellite GOES East (placed over the east coast of America, longitude 75° W) at 1200 UTC on 20 August 2007. The outlines of countries are overlaid and there is also a grid of reference marks (+). This image is taken in the infrared at a frequency particularly sensitive to water vapour. Light colours indicate greater amounts of water vapour and this is particularly clear around Hurricane Dean. Regions of moist (light) and dry (dark) air are also associated with the mid-latitude weather systems. |
| code | MI029 |
| Section | Meteorological instruments |
| Subsection | Satellites |
| image credit | © 2007 EUMETSAT |
| thumbnail | 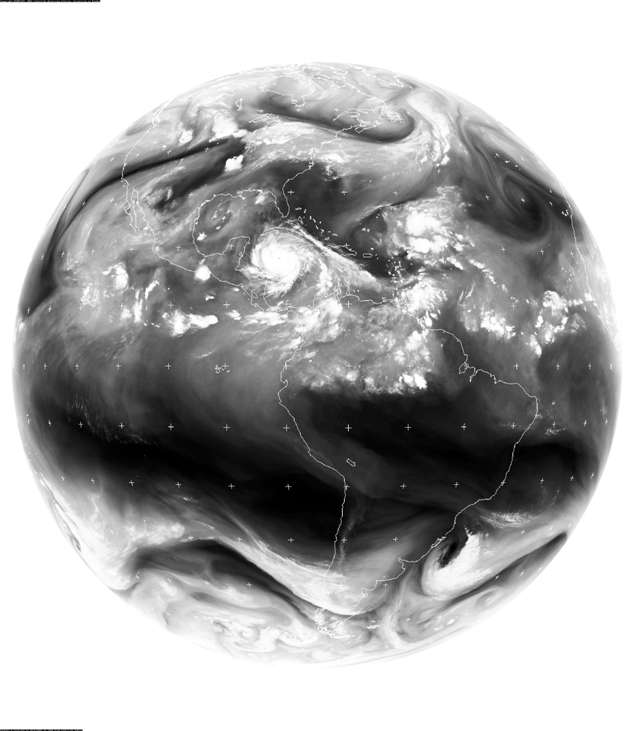 |
| File | |
| image title | Water vapour image from Meteosat SEVIRI |
| caption | Greenwich Meridian, longitude 0°) at 1200 UTC on 2 May 2008. The outlines of countries are overlaid and there is also a grid of reference marks (+). This image is taken in the infrared at a frequency particularly sensitive to water vapour. Light colours indicate greater amounts of water vapour and this is particularly clear in equatorial convective systems. Regions of moist (light) and dry (dark) air are also associated with the mid-latitude weather systems and there is significant water vapour even in regions which are cloud-free in the visible and infrared images, for example over north Africa. |
| code | MI023 |
| Section | Meteorological instruments |
| Subsection | Satellites |
| image credit | © 2007 EUMETSAT |
| thumbnail | 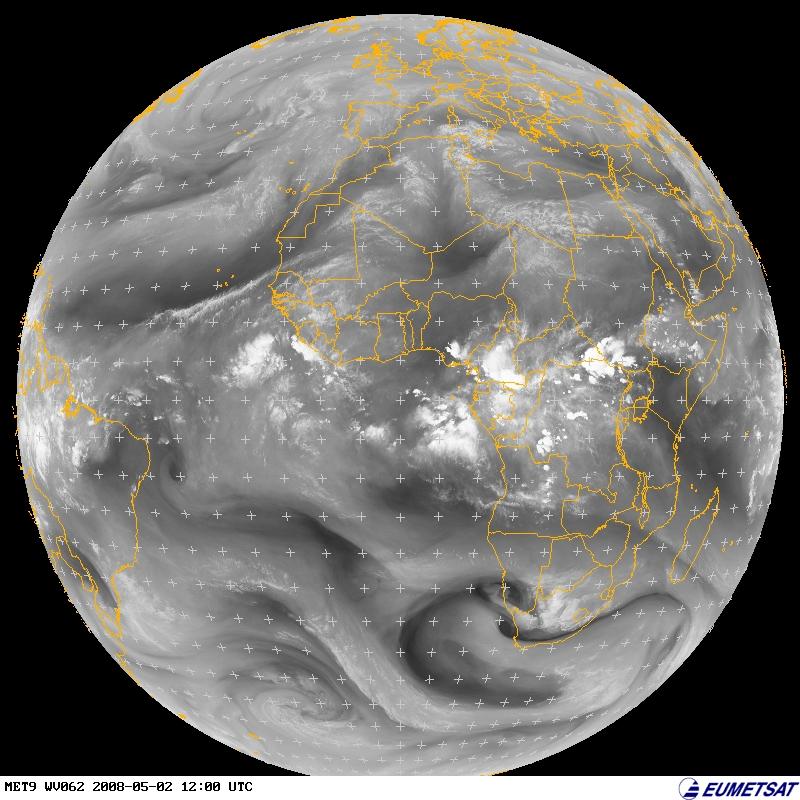 |
| File | |