

3 How certain can we be?
You have seen that both data and judgement are used in climate science. But with judgement comes uncertainty.
How certain can we be of our science? After all, the world depends on us getting it right!
In the activity which follows, you will be rolling a set of virtual dice and plotting the frequency of dice rolls in a histogram. Is one of the dice loaded? How certain can you be of your results to make this judgement?
This section is a practical application of the idea that climate is a distribution. It demonstrates key issues of uncertainty and data, by using distributions of dice rolls as an analogy for climate.
Activity 2 Find the casino cheat
You are at a casino playing craps, a dice game where players roll a pair of dice and bet on the outcome. You suspect one of your fellow players is switching one of the dice for a loaded (unfair) die each time she rolls, making her odds of successful prediction higher than yours.
You need to count the numbers rolled by both dice to try and deduce whether one die is loaded and whether your companion is a cheat.
You will record the results in a histogram, measuring the frequency of the different numbers, 1 to 6. The horizontal axis shows the different numbers on the dice, and the vertical axis shows how often each number is rolled. By recording the results of the dice rolls, you can determine whether or not one of the dice is loaded – whether some values are more likely than others.
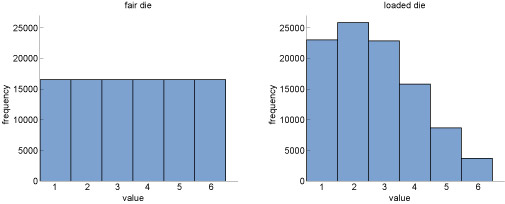
So, you can see what you are looking for, Figure 6 shows frequency histograms from dice rolls of (a) a normal die and (b) a loaded die.
Below are your two dice. You have a counter for the number of times you roll. Histograms beneath the dice show the frequency of each value you roll for each die.
Roll both dice 15 times – either by selecting the ‘Roll’ button 15 times, or by choosing the number of rolls required from the list and then selecting ‘Roll’. The values you roll will be automatically added to the graphs below. You can select ‘Reset’ to clear the dice rolls and the histograms at any time.
After 15 throws, can you tell whether one of the dice is loaded?
Answer
You will likely find there is a lot of variation in frequencies for both dice. One die might look more loaded than the other, but would you be confident with the data? Be careful of drawing conclusions – 15 rolls of a dice actually make up a small sample size, unless the loading of the die is very strong.
Try again: roll the two dice another 15 times.
How do the extra rolls change the histograms?
Answer
They should make the heights of the bars for a fair die more equal in height and the heights of the bars for a loaded die more unequal. But the picture may still not be clear – again, there may not be enough data to draw conclusions.
The histogram gets closer to the true distribution as you collect more data. If you like, you can add more dice rolls – as many as you like.
So, do you think one of the dice is loaded? If so, which number is the most likely value to be rolled? How confident are you in these results?
Answer
The answer is … not going to be given here! It might feel frustrating not knowing the correct answer, but this is the reality of scientific research.
There is no right answer to this activity. In real research, the true answer isn’t always known. The key to estimating the true answer is statistics: the collection, analysis, interpretation and presentation of numerical data. Scientists use a variety of statistical techniques to analyse data and estimate their uncertainty about the results.
The point is, the more data you collect, the more likely you are to be able to find patterns in the data. The more data you have, the more confident you can be in your judgements, and the level of certainty increases.