Skip to content
Skip to main content

About this free course

Download this course

Share this free course

Could we control our climate?

Start this free course now. Just create an account and sign in. Enrol and complete the course for a free statement of participation or digital badge if available.

2 Taking Earth’s temperature

Taking Earth’s temperature is an important measurement for climate science. But how is it possible to take the temperature of an entire planet like the Earth?

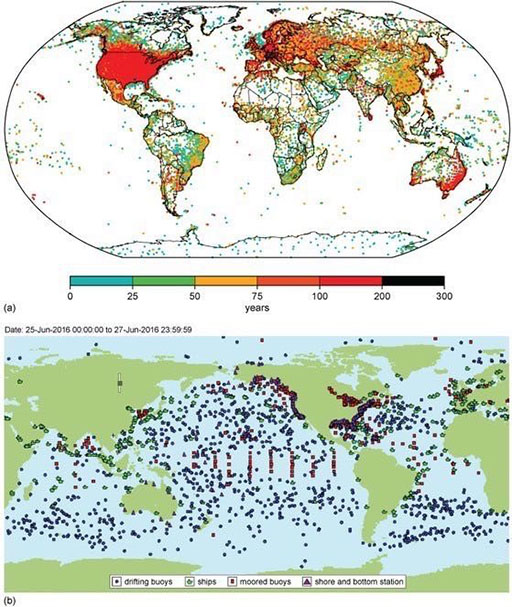
Weather over land is observed by ~11 000 weather stations dotted around the planet (Figure 3a). The vast majority are at ground level, while some are mounted on weather balloons and aircraft. Over the oceans, weather data are collected by ships, buoys and fixed stations on islands and platforms such as oil rigs.

Figure 3b shows a snapshot of locations measuring sea surface temperature. Since the late twentieth century, we have also had technologies watching the planet from space: satellites. These ‘Earth Observation’ satellites can measure a variety of aspects of the Earth system, including upper air temperature (tens of kilometres above the ground) and sea surface temperature.

Figure 3a - This global map shows the worldwide network of land stations in the Global Land Surface Meteorological Databank (Rennie et al. 2014). The colour corresponds to the number of years of data available for each station. The network is older and denser over the USA, Europe, Australia and Japan; dense but newer over much of Asia and South America whilst sporadic over much of Africa, Northern Asia, Antarctica, Greenland (and ocean areas). Figure 3b - This global map shows a snapshot of the locations of the NOAA Observing System Monitoring Centre network (NOAA, 2016) measuring sea surface temperatures with markers for drifting buoys, ships, moored buoys and shore & bottom stations. Drifting buoys have coverage across all oceans but with the highest density in the Pacific, southern Indian Ocean, South Atlantic and North Atlantic between the eastern USA and Africa. Ships are distributed mainly around coastlines and the centres of oceans, with high densities around the Chinese coast, the north Atlantic between the USA and Africa, the west African coast and around the European coast. Moored buoys are found within the central Pacific ocean, the Bay of Bengal, the west coast of Canada, the Great Lakes, and around the European coastline. Shore and bottom stations are mainly distributed around the east and west coasts of the USA and the Australian coast. Figure 3c - This stacked line graph shows the fraction of sea surface temperature observations made with different methods: buckets (shaded blue), engine room intake and hull contact sensors (green), moored and drifting buoys (red) , and unknown (yellow). The x or horizontal axis shows the year from 1920 to about 2010. The vertical axis shows the fractional contribution to global average SST. The graph shows that measurements were exclusively by buckets initially, declining through the period to zero (with a steep decline, then recovery for the few years after 1940). Engine room intake measurements were introduced in the 1930's and have increased to about 0.4 (i.e. 40%)by the 1980's, declining a little to the present. Buoy measurements were introduced around 1980 and have increased almost linearly to over 0.6 of the total by the present day.
Figure 3 (a) The worldwide network of land weather stations (Rennie et al., 2014). The colour corresponds to the number of years of data available for each station. (b) A snapshot of locations measuring sea surface temperatures (NOAA, 2016).
  • Looking at Figure 3a, which three regions of the world’s land have the poorest coverage of weather stations?

  • Greenland, North Africa and Antarctica.

  • Name two characteristics of areas where land stations tend to be located.

  • They tend to be located in areas of higher population and in more developed countries.

If humans have been taking the Earth’s temperature for many years, are we seeing a shift in global temperature?