1.1 The scale of scholarship over the centuries
History of the deluge
Today we talk about the information overload, but this isn’t new:
Is there anywhere on earth exempt from these swarms of new books?
… that horrible mass of books which keeps on growing… in the end the disorder will become almost insurmountable.
Imagine making an index for a book without using a computer, going through each page and compiling an alphabetical list of the principal words and their page numbers. Indexing (and concordance as you saw in Week 1, Session 1) are old tools but today we can compile them on a computer in seconds (compared to a production line of medieval friars in the past). We can now navigate large texts interactively and instantly.
Activity 1 Index calculations
Imagine you have 2 pages of text with 500 words each. How long would it take you to compile an index? (Try a quick experiment by building an index to some text that you have at hand.)
Now imagine you have 100 pages. How long would this take with pen and paper?
The complete works of Shakespeare’s plays is 836,000 words. How long would it take you to compile an index them? How long would it take with a team of 40 people?
Discussion
Broadly, working with 50 times as much text would take 50 times as long. But as words are searched for and added to the index – it will take more time as the list grows, so everything slows down. A computer scientist will point out that sorting takes ‘worse than linear time’, so doubling the size of the problem takes more than twice as long!
Scale today and tomorrow
How big is a library today?
The HathiTrust [Tip: hold Ctrl and click a link to open it in a new tab. (Hide tip)] is a collaboration of research libraries founded in 2008 containing over 17 million digitised items. It offers both reading access (allowable by copyright law – about 39% is in the public domain) and it also allows computational access to the entire corpus for scholarly research – so your programs can read all the text even though you can’t.
Digital Humanities at scale uses statistics and statistical concepts. There are many good books and online resources to help learn statistics, some focusing on particular domains (see the list of Further reading at the end of this week for suggestions).
Sampling
When can we make an inference about a larger set of data of which we have just a ‘sample’? Could we say the page lengths of the books on your bookshelf (your ‘sample’) are typical of all books? If you had a completely random selection of books from your collection then they might tell us something about the whole collection, but if they were not a representative selection (e.g. they were all children’s books, or just books that happen to fit on this shelf) then they couldn’t.
We have to know how the sample was selected in order to draw conclusions. This issue arises a lot in digital humanities as we often have incomplete data, our content might be an ‘accident of preservation and discovery’, a result of editorial and acquisition policies, and our own search and discovery process (see Session 3). If a collection isn’t complete then the absence of evidence is not evidence of absence. Just because a collection is digital doesn’t mean it’s complete.
Probability
Probability helps us understand what the chances are of something happening. When you roll two dice, the chances of throwing a double six are 1 in 36: this is because there are 36 ways the dice are equally likely to fall (6 times 6) and only one gives you a double six. We count all possible outcomes and what fraction of those are the ones we’re interested in.
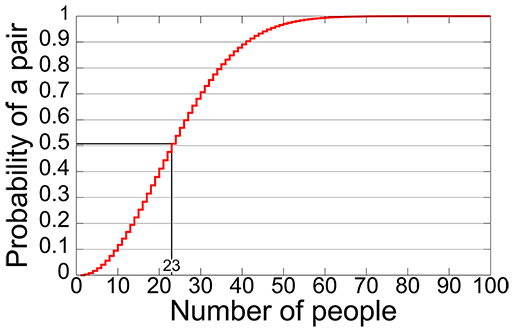
Imagine you are a genealogist and you find two separate records for an individual with the same birth date in a small village. What are the chances they are actually the same person? You might think the odds are against this, but its surprisingly likely that two separate people have the same birthday. You can find explanations online (look for ‘birthday paradox’) which show 50% probability with 23 people and 99.9% probability with just 70.