Analytical science: Secrets of the Mary Rose
Use 'Print preview' to check the number of pages and printer settings.
Print functionality varies between browsers.
Printable page generated Thursday, 25 April 2024, 11:07 PM
Analytical science: Secrets of the Mary Rose
Introduction
This course describes the scientific analysis of the historic Tudor warship, the Mary Rose, which sank in 1545. It will show you the techniques used to locate her after she lay for several centuries on the seabed, how analysis plays a role in her continued preservation and how analytical techniques are applied to investigate her and her crew to gain insight into Tudor life and why she sank.
This OpenLearn course is an adapted extract from the Open University course S240 Analytical science: health, heritage and environments.
Learning outcomes
After studying this course, you should be able to:
appreciate why and how scientific analysis can be applied to ancient artefacts such as the Mary Rose
understand how sonar surveys can be applied to locate shipwrecks and other objects buried under the seabed
identify techniques that can be used to ascertain the preservation state of artefacts
describe how bones and teeth can be analysed to investigate the origins, health, nutrition and activities of a deceased human being
understand how bacterial and chemical degradation of artefacts can be investigated and mitigated against.
1 The Mary Rose
The Mary Rose was a 16th-century battleship built at the request of King Henry VIII of England. It was built from elm and oak timbers and launched from Portsmouth Docks in 1511, representing the first big ship of the Tudor naval fleet, the forerunner to the UK's Royal Navy. It is estimated that over 600 trees (or 16 hectares of forest) were needed for the construction! (A hectare is 10 000 m2.)
For the time, the Mary Rose was the pinnacle of fighting prowess; she was purpose-built to hold a fully integrated weapons system, carry troops and fight in a range of naval environments. The hull was equipped with gun-ports from which bronze and iron cannons could be fired, and their positioning maintained the ship's stability in the water. Each gun was designed for its position in the ship and they were held on wooden gun carriages so they could be pulled into the hull for cleaning and loading. During combat, the crew of over 400 men also carried longbows, handguns and knives.
The first battle engagement was in 1512 where the French fleet was defeated with ease and the Mary Rose became the flagship of King Henry VIII's fleet. She was refitted twice with new timbers, in order to remain in the service of the King for over 33 years. However, on 19 July 1545 the ship sank in the Solent, off the north coast of the Isle of Wight.
2 Raising the Mary Rose
Reports in 1836 that fisherman had snagged their nets on wreckage bolstered confidence that the Mary Rose was still intact on the seabed after more than 300 years. At the time, divers retrieved several of the guns, but salvage operations failed to raise the ship to the surface. In the 1960s, a team of professional divers were tasked with investigating Solent shipwrecks. They began an earnest search for the Mary Rose using the coordinates given by the 19th-century salvage team.
It is often impossible to locate buried objects such as the foundations of ancient buildings or shipwrecks, without using geophysical surveys that can investigate the upper few metres of the subsurface by looking for differences in density or physical properties. Seismic surveys are used to locate buried building foundations on land. However, the seabed is relatively unconsolidated compared with the land surface so instead, for potential archaeological sites underwater, the geophysical technique of choice is sonar.
2.1 Sonar and shipwrecks
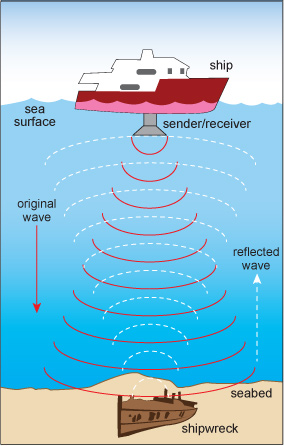
Submarines use sonar to detect other nearby vessels, and dolphins and bats use sonar as their primary navigational device. When used in archaeology, sonar works by emitting a pulse of sound (a ping), which is reflected (echoed) back by a solid object (Figure 1). The seabed may reflect the ping to some extent, but solid objects, such as buried shipwrecks, cause major reflections. Echoes are detected and the location and depth of objects pinpointed. Since the 1960s, sonar surveys have located a huge number of buried objects at sea.
The two types of sonar that are most commonly used for underwater archaeology are side-scan sonar and multi-beam sonar. Side-scan sonar consists of an emitter towed by a ship, which emits two pulses of sound from either end. Multi-beam sonar emits several pulses from a collection of emitters distributed across the hull of a ship. Side-scan sonar consists of a single detector on the towed instrument, but multi-beam sonar uses several detectors placed across the hull of the ship. This means that multi-beam sonar can collect more echoes and provide much greater detail than side-scan. Both side-scan and multi-beam surveys generate data that is digitally converted into images.
The differences between the resolution of these two types of survey are illustrated in Figure 2. This figure shows a multi-beam sonar image of the site where the Mary Rose had once occupied the seabed. The deep purple colour at the centre of the image represents the dip left in the seabed after the ship was removed.
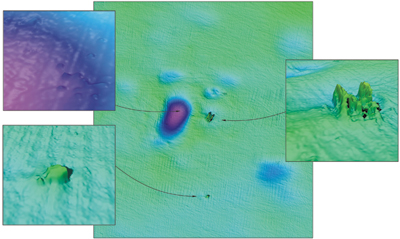
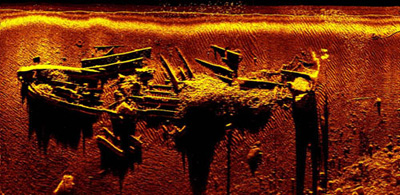
Figure 3 shows another timber ship, HMS Impregnable, which sank in the English Channel in 1799. This image was obtained using a side-scan survey, and when compared with Figure 2 shows the difference in resolution that can be obtained by multi-beam sonar. (Note that not all of HMS Impregnable is preserved on the seabed.)

Inevitably, the best targets for sonar survey are ships or other objects made from metal, which are strong reflectors of sound waves, although ships constructed from timber are more often than not the most common targets sought. Figure 4 shows how a side-scan survey is improved if the target is made of metal rather than timber, thus giving a stronger reflected signal. Figure 4 is of the Lidador, a former trans-Atlantic steamship, which sank in the Azores during bad weather in 1878.
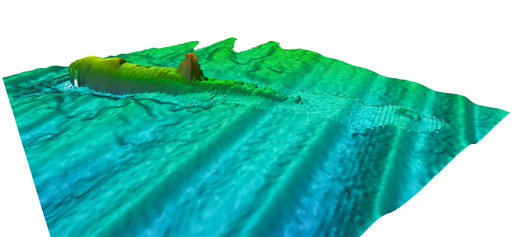
Side-scan and multi-beam surveys can be combined: Figure 5 shows a combined digital image generated by such a survey, which includes information about the wreck itself (HMS A1, the first submarine commissioned for the Royal Navy) and the seabed itself. Only part of the submarine has been preserved on the seabed.
Sonar surveys are often combined with other instruments, such as magnetometers, which detect differences in magnetic properties, for example due to the presence of metal.
Sonar surveys of the Solent discovered the presence of a large buried object near to the alleged wreckage site, resulting in a concentrated investigation in that area. Divers confirmed, through the retrieval of artefacts, that part of the Mary Rose was preserved at only 11 m below low tide. (Further information about the artefacts found with the Mary Rose is given in Box 1.) This discovery led to huge publicity and an influx of financial support for the underwater excavation and salvage. On 11 October 1982, after 437 years underwater, the Mary Rose was carefully raised from the seabed by a hoist and cradle.
Box 1 The Mary Rose artefacts
Before raising the Mary Rose, 28 000 dives were made to investigate the wreck and retrieve artefacts and human remains. These items provided a wealth of information about life on board, and opportunities for scientific analysis.
Many of the artefacts appeared to have been personal possessions of the crewmen: dice, backgammon, inkwells and quills, clothing and shoes, fiddles and bows, and pipes. Navigational callipers, protractors and tide calculators were found in one cabin, which was assumed to belong to the ship's navigator. Similarly, a cabin full of surgical tools was thought to belong to the ship's barber-surgeon, who looked after the well-being of the crew. There, a long copper syringe was found that was thought to be used to treat gonorrhoea, which was prevalent at the time, by injecting mercury into the urinary tract as a disinfectant.
A wooden chest was found in the barber-surgeon's cabin, which contained bottles and jars full of what today would be called pharmaceuticals; other bottles were found scattered around the same cabin. Although there are historical reports of Tudor medicines, direct sampling is rare. The fragility of these containers meant that care had to be taken to sample their contents, but without their analysis the nature of these pharmaceuticals would remain unknown.
The contents of the bottles and jars were analysed using a technique called Raman spectroscopy (Edwards et al., 2004). Unfortunately, because of the influx of silt and mud over hundreds of years, the results from these analyses were inconclusive and largely represented only the seabed material, rather than the medicinal products.
3 The sinking of the Mary Rose - a Tudor mystery
Much post-salvage analysis of the Mary Rose has been focused on determining why and how the ship sank. This mystery highlights the interplay between scientific analysis and historical records that is key to analysis in the heritage sector.
The importance of the Mary Rose to the English naval fleet means there are many historical records about it; however, the reason for the sinking was not recorded. Before the Mary Rose was salvaged, historians debated the matter of the sinking at length. Historically, it is known that, in July 1545, the French naval fleet entered the Solent with the intention of invading the Isle of Wight. They brought 200 ships, significantly outnumbering the English fleet. French historical reports suggest that at dawn on 19 July, a battle began and, shortly after, the Mary Rose keeled over and sank. However, the ambassador to the Holy Roman Emperor, van der Delft, recorded that he:
'was told by a Fleming among the survivors that when she heeled over with the wind the water entered by the lowest row of gun ports which had been left open after firing.'
A second eyewitness report came from the brother of Sir George Carew, the Mary Rose's Vice-Admiral. Carew's brother, who was on a neighbouring ship, claimed Sir George Carew had shouted to him shortly before the ship sunk that 'he had the sort of knaves whom he could not rule'.
Naturally, these reports may be tinged with political propaganda, France claiming destruction of the King of England's favourite ship, and the crew intimating a terrible accident. Sir George Carew's obituary stated that his negligence was responsible for the sinking of the ship and contemporary writings indicated that his poor ruling of the ship had led to anarchy and unruliness.
Surprisingly, considering the importance of the Mary Rose to the naval fleet, there are few records about the crewmen, except for high-ranking officers such as Sir George Carew.
Of the 415 men recorded as being on board when the Mary Rose sank, only 35 survived, and human remains were found on board the shipwreck that became the focus for analysis. It was hoped that this analysis would provide clues to the ship's unexpected sinking.
4 Analysis of the Mary Rose crew's remains
Human remains were found scattered across the floor of the ship due to the action of the sea and the deposition and movement of sediments in the Solent. After excavation, the bones were collected and washed in freshwater. They were curated according to where they were found and then pieced together bone by bone. Only 92 complete and 179 incomplete skeletons could be found. The excellent anoxic (oxygen-poor) preservation conditions on the seabed also meant that some organic matter was preserved within the bones.
4.1 Determining the gender of the crew
It is not always obvious when dealing with remains, particularly in archaeology, what the gender of the deceased was. For humans, a wealth of information can be provided by the body to help to determine their gender, by comparing skeletal structure (Figure 6):
- the skull - in males, the skull typically has a more prominent brow and larger lower jaw bone (mandible) than in females
- the clavicle (collar bone) - males typically have straighter, thicker clavicles than females (who may have a more V-shaped collar bone)
- the rib cage - females generally have a shorter rib cage than males of similar height
- the sternum - the central breast bone is typically broader and longer in males than in females
- the pelvis - the female pelvis is wider and has a much larger cavity compared with the male pelvis, which is typically more enclosed
- the tibia (shin bone) - females generally have thinner tibias than males.

Carefully measuring and comparing the size and shape of bones from adult human remains and comparing them with modern-day records is a means of determining gender with a relatively high level of certainty. Although the gender cannot be definitively determined from measurements of a single bone, by combining evidence from several bones, or using this evidence in conjunction with other information, it is possible to improve the certainty of gender identification. All of the 92 complete skeletons on the Mary Rose were male (Stirland, 2005). Some were adolescents and at least one was a child, but it is not generally possible to determine the gender of adolescents and children from the size and shape of the bones, as the skeleton continues to grow at varying rates until late adolescence (or early adulthood).
Gender can also be determined by analysing aDNA (ancient DNA) when only bone fragments or organic remains are preserved.
Karyotyping is used to identify the presence of X or Y chromosomes.
What chromosomal pairing would you expect to see for (a) females and (b) males?
(a) Females will exhibit an XX pairing and (b) males an XY pairing.
4.2 Determining height and weight
Determining the height and weight of an individual requires access to the skeleton or skeletal fragments. Although bones can easily be measured, it is important to remember that bodies shrink slightly after death, so the original height of a living individual will be slightly greater than that measured directly from a corpse.
An accurate method of determining the height is to measure the length of specific long bones (i.e. the three long leg bones - femur, tibia and fibula - and the three long arm bones - humerus, radius and ulna; see Figure 6 in Section 4.1). This method assumes that different parts of the adult body are in proportion with each other, and that the relative proportions between height and leg or arm length vary according to the gender and the ethnicity of the individual. By averaging measurements from many individuals in a specific ethnic group (and separating them into male and female), the average relationship between height and limb length can be established. This is then used to calculate the full body height of any other individual from that group, by applying a method called regression analysis.
Regression analysis involves measuring changes in one item (called a variable) to predict how a related variable will change. For example, changes in the length of a long bone can be used to determine an individual's full height. The relationship between long bones and full height is determined by taking measurements of different long bones in modern adult corpses and comparing them directly with the individual's measured height. A mathematical equation can then be applied to link the changes in bone length to overall height. The multiplying factors used in the equation differ according to:
- the type of long bone used
- the broad ethnic origin
- the gender of the individual being investigated (Table 1).
When the ethnicity or gender of an individual is unknown, an equation can be used to allow an approximate height to be calculated.
| Bone type | Ethnicity | Male equation | Female equation |
|---|---|---|---|
| femur | Caucasian | (length × 2.32) cm + 65.53 cm | (length × 2.47) cm + 54.13 cm |
| African | (length × 2.10) cm + 72.22 cm | (length × 2.28) cm + 59.76 cm | |
| Asian | (length × 2.15) cm + 72.57 cm | not available | |
| tibia | Caucasian | (length × 2.42) cm + 81.93 cm | (length × 2.90) cm + 61.53 cm |
| African | (length × 2.19) cm + 85.36 cm | (length × 2.45) cm + 72.56 cm | |
| Asian | (length × 2.35) cm + 81.45 cm | not available | |
| fibula | Caucasian | (length × 2.60) cm + 75.50 cm | (length × 2.93) cm + 59.61 cm |
| African | (length × 2.34) cm + 80.07 cm | (length × 2.49) cm + 70.90 cm | |
| Asian | (length × 2.40) cm + 80.56 cm | not available |
Calculate the true height (to the nearest cm) of a Caucasian male whose tibia measures 39.0 cm.
The true height is 176 cm:
(39.0 × 2.42) cm + 81.93 cm = 176.31 cm = 176 cm (to the nearest cm).
4.3 Determining the on-board diet
There was no evidence from observation of the bone shapes that the sailors died of anything other than drowning; however, they may have had conditions in childhood or adulthood which would have left their marks on the skeleton. Many of the men were found to have had a condition called 'os acromiale' where the shoulder blade has not fully fused together. This is thought to result from the persistent use, since childhood, of longbows in training and battle. The bones also reflected one of the most common problems associated with a life at sea in those times: rickets (in adolescents, or osteomalacia in adults), caused by vitamin D deficiency and leading to weak and deformed bones. There were no faecal remains available from which to ascertain the crewmen's diet and their final meal(s) that may have confirmed whether these health conditions were due to a seafaring life.
4.4 Determining the nationality of the crew
Although organic matter was well preserved in the bones of the sailors, no substantial data on its DNA analyses has been published at the time of writing this course. There has been preliminary work, and the haplogroups identified suggest that the crew may have been of mixed ethnicity, sourced from across Europe. This is surprising, as it was originally considered that the majority of the crew were English.
Stable isotope ratio mass spectrometry can be used to determine the oxygen isotope composition of the crew's remains. Stable isotopes are isotopes that do not undergo radioactive decay and occur at fixed amounts within the Earth. However, variations in the abundances of stable isotopes can occur during reactions and processes that occur in the natural environment. In general, the light isotope of an element will react more readily than the heavier isotope. This process is known as isotopic fractionation.
Oxygen has three stable isotopes, 16O, 17O and 18O. Oxygen is incorporated into the teeth and bones (and shells) of all living organisms. All of the water that humans consume, whether it is drinking water or within food, comes from rivers and oceans with oxygen present within H216O, H217O and H218O. However, climatic factors such as temperature and winds can result in isotopic fractionations; oxygen isotope ratios can therefore be used as geographical tracers.
Abundances of oxygen isotopes are given as ratios, e.g. 17O/16O or 18O/16O and are determined using a stable isotope ratio mass spectrometer. Once these ratios are obtained for a sample, this is mathematically converted into a delta value, e.g. δ18O. Delta values compare the isotope ratio of a sample (e.g. 18O/16O in the case of δ18O) to that of a standard. This value is then multiplied by 1000 to give the delta value in parts per mil (‰).
Stable isotope ratio mass spectrometry was applied to samples of tooth enamel from 18 of the complete skeletons excavated from the Mary Rose. Most had δ18O values of around +24.7‰ to +25.8‰; however, six samples had values of >+27.0‰ (Bell et al., 2009).
As it was originally assumed that the crew of the Mary Rose were English, or at least British, in origin, studies of enamel from 12 British subjects were analysed in conjunction with samples from the Mary Rose. (The study also included horses from Britain, since their tooth enamel exhibits similar regional distinctions.) Modern enamel revealed δ18O values ranging from +23.5‰ to +26.0‰. Other studies have revealed British enamel to have δ18O values as high as +26.8‰.
The majority of enamel from the Mary Rose samples had δ18O values consistent with modern enamel; however, six samples were enriched in 18O. Enriched 18O is associated with hot or lower latitude environments. Therefore, these results suggest that several of the crew may have been from latitudes south of Britain and may not have originated in Britain.
Comparing this modern enamel with the Mary Rose data from bones, was the Mary Rose data consistent with modern enamel, enriched or depleted in 18O?
The majority of enamel from the Mary Rose samples had δ18O values consistent with modern enamel; however, six samples were enriched in 18O.
What might enriched 18O values suggest about the origins of some members of the Mary Rose crew?
Enriched 18O is associated with hot or lower latitude environments. Therefore, these results suggest that several of the crew may have been from latitudes south of Britain and may not have originated in Britain.
Although it is difficult to say for certain that members of the crew were not from Britain, this has been cited as a possible reason for its sinking: poor communication between the crew members because of language barriers may have resulted in misinterpretation or even ignorance of orders. Despite these clues, the true reason for the sinking of the Mary Rose will remain a mystery until more information can be obtained through analysis of the salvaged ship.
5 Preserving the Mary Rose
For over 400 years the Mary Rose lay on the seabed. During that time, her timbers became waterlogged and weakened and were attacked by bacteria and marine organisms. It was important to understand the preservation state of these timbers both before and after salvage, to ensure the Mary Rose could be conserved for future generations to enjoy and study.
Wood is composed of cellulose, a complex macromolecule consisting of chains of glucose molecules linked together by oxygen atoms (Figure 7). The chains of glucose molecules are held tightly together by hydrogen bonding, resulting in a tough, fibre-like structure. In chemical terms, cellulose is a polysaccharide. (Polysaccharides are complex sugar molecules composed of repeating units of monosaccharides such as glucose.) Figure 7 shows three glucose units linked together. In reality, many thousands of glucose units are present in each chain, and a large number of these straight chains are packed very tightly together.
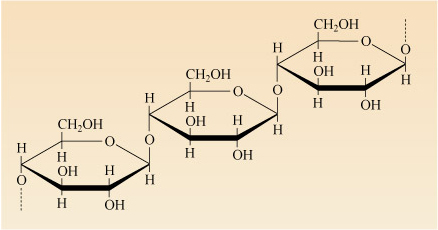
There are also other components to wood: hemicellulose (another polysaccharide made up of branching chains of glucose, xylose and other sugar molecules) and lignin (a complex molecule that binds the cellulose and hemicellulose together). When wood is waterlogged, the water seeps into the structure of the cellulose, and binds to the glucose molecules by hydrogen bonding, causing the wood to swell. This weakens the structure of the wood.
Cellulose and hemicellulose are easily attacked by aerobic biological organisms (i.e. those that thrive in oxygenated conditions). These organisms use the sugar molecules for respiration (according to the reaction described in the chemical equation below) generating carbon dioxide and water as products:

Weak swollen wood is especially attractive to biological organisms.
On salvage, the Mary Rose's timbers began to dehydrate when the water trapped in the wood's structure evaporated, causing the wood to shrink and crack, and the cellulose structure to collapse. If left to proceed, this would ultimately lead to a complete loss of the timbers' structural integrity and disintegration of the ship. Therefore, it was necessary to maintain the waterlogged conditions in order to preserve the ship intact. On salvage, a system of cold water spraying was developed that would allow the wood's structural integrity to be sustained across the whole hull. The ship was also kept in a huge refrigerated room where the temperature was maintained between 2 and 5 °C and under low-level lighting.
Analysts ascertained the extent and type of decay taking place in the timbers in order to prevent further deterioration. They did not analyse entire timbers, although most needed to be sampled using the least disruptive methods possible.
Why would it be necessary to sample several timbers if they had all experienced similar burial and preservation histories?
The timbers may be made from different types of wood, which may have differing susceptibilities to decay. Recall that the Mary Rose was refitted twice with new timbers, so they may also have been of different ages, or used in different locations on the ship.
The use of timbers of different ages and at different locations also meant that there was potential for varying degrees of degradation.
What steps could be taken to ensure that subsequent analyses were representative of the ship as a whole, despite sampling constraints?
In any analysis, it is important to repeat the analysis on another portion of the same sample to ensure the results are accurate.
5.1 Assessing the moisture content of wood
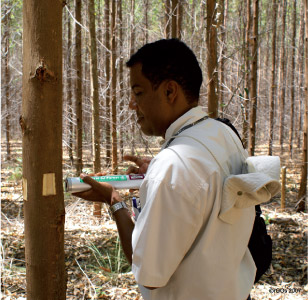
Dry wood is usually sampled by coring, similar to coring an apple. However, because the Mary Rose's timbers were waterlogged, coring proved difficult. Instead, an instrument called a pilodyn was used (Clarke and Squirrell, 1985). This can directly determine the density and strength of wood without the need to extract samples.
Pilodyns were developed to assess the extent of decay of wooden utility poles, such as telegraph poles, and have since been used for railway sleepers, trees and architectural timbers. A pilodyn uses a spring of known tension to fire a 40 mm-long pin into the wood (Figure 8). Springs are rated according to the energy they impart on the pin, for example pins used for Mary Rose timbers were rated at 2 and 6 joules. When the pin is fired into the wood, the depth it penetrates, in millimetres, is read from a scale. The depth of penetration depends on the rating of the spring used and the strength of the cellulose and lignin, which is governed by its moisture content; a depth of penetration greater than 40 mm is considered to be characteristic of waterlogged wood.
It is interesting to note here that, with some modifications, divers were able to use pilodyns to assess the moisture content of the ship's timbers even before the salvage. The results from the underwater analysis of oak timbers from the Mary Rose are shown in Table 2. Note that the depth of penetration is greater at the ends of the beams (20-40 cm along). These parts of the beams were in contact with the ship's hull, the exterior part of which were likely to be more exposed than the ship's interior. Surprisingly, the extent of waterlogging did not decrease progressively to the interior of the beam.
Look at Table 2. Do the timbers show a progressive alteration from interior to exterior?
No, there is no trend of increasing degradation from interior to exterior. Instead, degradation was patchy, with highly degraded material beside better preserved material.
| Distance along timber/cm | Depth of penetration/mm | |||||
|---|---|---|---|---|---|---|
| Beam 1 | Beam 2 | Beam 3 | ||||
| From port | From starboard | From port | From starboard | From port | From starboard | |
| 20 | 46.5 | 32.0 | 20.5 | 24.5 | 32 | 58.4 |
| 40 | 17.5 | 26.5 | 14.5 | 29 | 32 | 26.5 |
| 60 | 14.5 | 17.5 | 11.5 | 19 | 17.5 | 17.5 |
| 80 | 14.5 | 17.5 | 14.5 | 20.5 | 17.5 | 14.5 |
| 100 | 14.5 | 14.5 | 14.5 | 23.5 | 17.5 | 17.5 |
| 120 | 14.5 | 17.5 | 14.5 | 14.5 | 17.5 | 17.5 |
| 140 | 23.5 | 20.5 | 17.5 | 14.5 | 17.5 | 14.5 |
| 160 | 23.5 | 20.5 | 14.5 | 14.5 | 17.5 | 17.5 |
| 180 | 17.5 | 20.5 | 14.5 | 14.5 | 14.5 | 17.5 |
| 200 | 17.5 | 17.5 | 17.5 | 17.5 | 17.5 | 17.5 |
The results of the underwater pilodyn analyses were complemented by traditional moisture-content analyses (Squirrell and Clarke, 1987), similar to those used to assess the water content of food. Cubes of wood measuring 1 cm were cut from the timbers (oak, poplar and pine), weighed, and dried in an oven for 48 hours. After drying, they were reweighed, the mass difference being considered to represent the moisture lost. Moisture content was expressed as a percentage of the total mass of the samples when fully dried. The results of these studies supported the pilodyn results to show that the extent of waterlogging was uneven through the ship's timbers.
5.2 Assessing the biological degradation of wood
During the time that the Mary Rose lay on the seabed, it was covered by increasing layers of silt and mud. This resulted in anaerobic conditions within the shipwreck, meaning that there was no free oxygen available for aerobic biological organisms to thrive, although anaerobic microorganisms might have attacked the wood. These conditions prevailed while the ship was underwater, enabling the lengthy preservation. On salvage, the anaerobic conditions ceased and the Mary Rose became susceptible to attack by aerobic organisms, in particular microorganisms such as bacteria and fungi.
For some of the Mary Rose timbers, and even some of the wooden artefacts recovered, the effects of biological decay after salvage were unavoidable. For example, decay caused by the wharf borer beetle (Nacerdes melanura), which bores into wood during the larval stage in its life cycle, and the death-watch beetle (Xestobium rufovillosum) were evident on the timbers (Pitman et al., 1993). The high moisture content of the wood attracted both of these species and they consumed the moisture along with the wood.
What observations might be made to determine whether the Mary Rose timbers have been attacked by such insects?
Since both types of beetles bore into wood, evidence of boring, such as burrows and pits, could be identified by eye. These insects also thrive on moisture, therefore monitoring moisture levels of the timbers over time, using either the pilodyn or the oven-drying method, would give clues to whether they were subject to insect attack.
Some of the signs of attack by insects or bacteria may not be visible to the unaided eye. Which analytical technique(s) might be applied to investigate the physical effects of biological attack further?
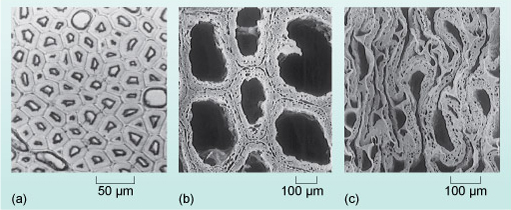
The wood could be looked at with a light microscope to see if any physical damage has been caused by boring (Figure 9a). Scanning electron microscopy (SEM) could also be used to gain higher resolution images (Figure 9b and c).
While insects such as the death-watch beetle may cause physical damage to the timbers of the Mary Rose, other less obvious biota also inhabited them. After salvage and storage in aerobic conditions, a yellow precipitate began developing on the surface of the timbers. Similar precipitates had also been seen on other shipwrecks that had spent time in anaerobic conditions. The chemical composition and origins of this yellow precipitate were investigated by X-ray diffraction.
5.3 Powder X-ray diffraction of the Mary Rose timbers
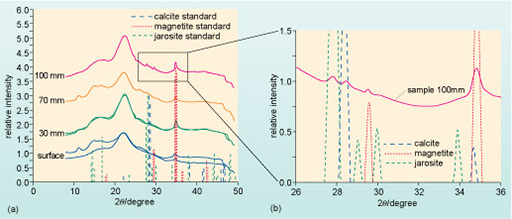
For the samples of the Mary Rose timbers with the mysterious yellow precipitate, the results of X-ray diffraction (XRD) analyses were compared with peak patterns from suitable standards. International standard databases are available that contain XRD patterns for thousands of crystalline samples, without the need to analyse standards at the same time as samples. Figure 10 shows the results from XRD analyses of the Mary Rose timbers compared with these standards (Wetherall, 2008). Note that the results are illustrated according to 2θ, since this is characteristic of each crystalline structure. (2θ is explained further in Box 2.)
Box 2 2θ and the diffraction of X-rays.
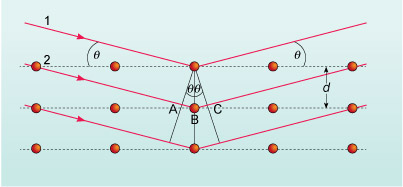
A model for the diffraction of X-rays by crystalline lattice planes was originally put forward by father-and-son team William Henry (1862-1942) and William Lawrence Bragg (1890-1971). They suggested that the interaction of an incident X-ray beam with a lattice plane could be viewed in the same way as light reflecting from the surface of a mirror. This is shown in Figure 11 in which the incident X-ray beam has an angle of incidence of θ (theta), with respect to the lattice plane, and is reflected at the same angle. This is called specular reflection. (Note, the lattice planes are two-dimensional and represented sideways-on in Figure 11 by the dotted lines.) During reflection, there is no change in the wavelength of the X-ray, so there is no energy change: this is called elastic scattering or Thompson scattering. Specular reflection will also apply to X-rays that penetrate to the second and subsequent lattice planes, that are separated by a distance, d. The reflected X-rays from the various layers will either constructively or destructively interfere with one another.
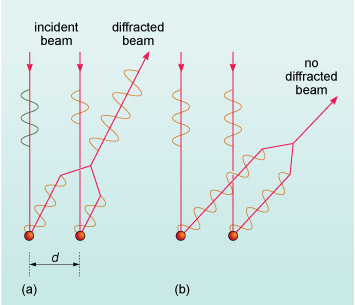
In the case of constructive interference (Figure 12a), the X-ray waves are in-phase with one another, so their displacements add. By contrast, destructive interference (Figure 12b) occurs when the X-ray waves are out of phase and their displacements cancel.
A simple calculation, based on Figure 11, can determine whether constructive or destructive interference occurs at a particular angle (θ). The path difference between the beams that have been labelled 1 and 2 is the length AB + BC and can be written as:
Note: sin is an abbreviation for sine, a mathematical function you will find on your calculator.
For constructive interference (Figure 12a), the path difference must be equal to an integral number of wavelengths, λ, since the waves will then be in-phase:
This is the famous Bragg Law where n represents the order of diffraction. (The strongest diffraction peaks arise from first-order diffraction when n = 1.) Only when this law is satisfied will the detector in the diffractometer give a response. This information is then converted electronically into a series of peaks representing X-ray intensity, angle of incidence and reflection (2θ).
The output from an XRD is a series of peaks representing X-ray intensity as a function of the angle 2θ. The pattern of peaks can be used as a 'fingerprint' for a given crystalline chemical compound so the diffraction pattern generated by an unknown sample can be compared with known patterns stored on a computerised database to identify the sample's composition.
At 2θ = 35° in Figure 10, there is a peak of high intensity from the Mary Rose precipitate. This corresponds with a peak characteristic of the iron oxide magnetite (Fe3O4) standard. A low intensity peak at 2θ = 29.5° also corresponds with a magnetite peak, so it is fairly certain that magnetite is present. Similarly, at 2θ = 28.5°, there is a low intensity peak, which corresponds with a peak from the calcite (CaCO3) standard. Unfortunately, other calcite peaks cannot be seen on the trace, so calcite may be present. At 2θ = 27.5°, a low intensity peak corresponds with one from the jarosite (KFe3[(OH)3SO4]2) standard but no other jarosite peaks can be seen in the Mary Rose precipitate, so it may be present.
The presence of magnetite was not surprising because of the oxidation of iron bolts in the timbers. However, the possibility of minerals rich in sulfur, such as jarosite, was intriguing since, in order for jarosite to form, it required a source of sulfur. It also required a source of oxygen since jarosite is produced from the oxidation of sulfur, so it must have grown once the ship was salvaged.
Certain types of anaerobic bacteria thrive by consuming decaying organic matter (which includes S-containing molecules) on the seabed, to produce hydrogen sulfide (H2S) as a by-product. This H2S can diffuse into wood and be converted by other bacteria into sulfur. In aerobic conditions, such as those that prevailed after the Mary Rose was salvaged, oxidation of sulfur to precipitates was accompanied by conversion of sulfur into sulfuric acid (H2SO4). This can easily degrade the wood's cellulose in a process called acid hydrolysis.
Estimates suggest there was over two tonnes of sulfur present in the Mary Rose timbers, which was not good news for the ship's conservation.
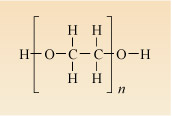
In 1994, the cooled water sprayed on the ship was replaced with a mixture of water and a wax called polyethylene glycol (PEG) which would pervade the wood and solidify, thus sealing it from further decay by bacteria or acid and preserving its structural integrity. PEG is a polymer composed of ether monomers (CH2CH2O), with an alcohol (-OH) terminal group at one end and a hydrogen at the other (Figure 13); the general formula for PEG is H(CH2CH2O)nOH, where n is the number of monomer units and can be up to 500. Thus, PEG binds, by hydrogen bonding, to the wood's organic molecules in the same way as water. Over time, the number of monomer units in the PEG sprayed onto the Mary Rose's timbers has been increased, meaning more PEG and less water becomes bound. This PEG-preservation technique was halted to allow the ship to be sufficiently dried out to be displayed in an accessible public gallery from 2012.
The Mary Rose and its artefacts continue to be analysed, enabling its future preservation and further investigations into Tudor life and the processes that operate on the seabed. Similar investigations of other ships, such as the Vasa, a 17th century Swedish warship, have benefited from the development of analytical techniques established and applied to the Mary Rose. However, further analysis of her intrinsic structure will be limited because of the damage this may do to her, particularly when she is on display to the public. For this, non-invasive techniques will need to be applied, similar to those used to analyse works of art.
Conclusion
The Mary Rose sank in 1545, taking the majority of her crew with her. Her rediscovery on the seabed, and subsequent raising, presented an ideal opportunity to apply scientific analytical techniques to investigate the wreck, crew and artefacts. These analyses are also crucial to determining the most appropriate methods of preserving her for future generations to enjoy.
Glossary
- acid hydrolysis
- The breakdown of organic materials using acid.
- aerobic
- Means 'with oxygen' and used in the context of organisms that require oxygen for metabolism. Compare with anaerobic.
- anaerobic
- Means 'without oxygen' and used in the context of organisms that do not require energy for metabolism. Compare with aerobic.
- anoxic
- Oxygen-poor conditions.
- constructive interference
- X-ray waves are in-phase with one another, so their displacements add.
- destructive interference
- X-ray waves are out of phase and their displacements cancel.
- haplogroups
- Groups defined by genetic traits found in mitochondrial DNA (as opposed to nuclear DNA).
- isotopic fractionation
- The natural separation of isotopes during a chemical reaction or process.
- karyotyping
- Chromosomal analysis for genetic and chromosomal abnormalities.
- pilodyn
- Instrument used to measure the density and strength of wood without the need to extract samples.
- Raman spectroscopy
- Raman spectroscopy harnesses the Raman effect in order to characterise the presence of molecules within a sample.
- regression analysis
- Measuring changes in one item (called a variable) to predict how a related variable will change.
- respiration
- The collective reactions used by the body to release the chemical energy of these molecules. (The meaning of the word respiration here should not be confused with the other meaning of the term to breathe.)
- scanning electron microscopy
- An electron microscope that uses a rastering electron beam to image and analyse a sample.
- sonar
- A technique utilising sound pulses which are echoed when they reach a solid object.
- specular reflection
- Where the incident X-ray beam has an angle of incidence of θ, with respect to the lattice plane, and is reflected at the same angle.
- X-ray diffraction
- X-ray diffraction (XRD) is the diffraction of short wavelength X-rays (in the region of 0.1 nm). It is widely used to investigate both single crystals and finely ground crystalline powders.
References
Acknowledgements
This course was written by Victoria Pearson.
Course image: Gary Bembridge in Flickr made available under Creative Commons Attribution-NonCommercial-ShareAlike 2.0 Licence.
The material acknowledged below is Proprietary, used under Licence and not subject to Creative Commons licencing. See terms and conditions.
Grateful acknowledgement is made to the following sources:
Figures 2, 3 and 5: Wessex Archaeology, used under a Creative Commons Attribution-NonCommercial-ShareAlike 2.0 Generic (CC BY-NC-SA 2.0);
Figure 4: Marine Sonic Technology, Ltd;
Figure 8: Roosevelt Almado;
Figure 9a: Finney, R.W. and Jones, A.M. (1993) 'Direct Analysis of wood preservatives in ancient oak from the Mary Rose by laser microprobe mass spectrometry', Studies in Conservation, vol. 38, 1993. International Institute for Conservation of Historic and Artistic Works;
Figure 9b and 9c: Blanchette, R.A. (2000) 'A review of microbial deterioration found in archaeological wood from different environments', International Biodeterioration and Biodegredation, vol. 46. Elsevier Science Ltd;
Figure 10: Wetherall, K. (2008) 'Sulfur and iron speciation in recently recovered timbers of the Mary Rose revealed via X-ray absorption spectroscopy', Journal of Archaeological Science, vol. 35(5). Elsevier BV.
Every effort has been made to contact copyright holders. If any have been inadvertently overlooked the publishers will be pleased to make the necessary arrangements at the first opportunity.
Don't miss out:
If reading this text has inspired you to learn more, you may be interested in joining the millions of people who discover our free learning resources and qualifications by visiting The Open University - www.open.edu/ openlearn/ free-courses