Week 6: Housing and the household balance sheet
Use 'Print preview' to check the number of pages and printer settings.
Print functionality varies between browsers.
Printable page generated Monday, 13 May 2024, 1:12 PM
Week 6: Housing and the household balance sheet
Introduction
Property as a home and as an investment. Buying a property – mortgage products. What are the total costs of buying? How do you repay your mortgage? Freehold and leasehold properties – what’s the difference?
More so than in many other countries, the health of the UK property market is of pivotal importance to the health of the overall economy. This week you’ll be exploring how the UK property market and the associated market in mortgages work. You’ll see how both housing and mortgages fit into the household balance sheet and you’ll complete this as part of your fact find. You’ll also get a link to a mortgage calculator to enable you to look into the cost of a mortgage.

Transcript
This course is presented with the kind support of True Potential LLP.
The True Potential Centre for the Public Understanding of Finance (True Potential PUFin) is a pioneering Centre of Excellence for research in the development of personal financial capabilities. The establishment and activities of True Potential PUFin have been made possible thanks to the generous support of True Potential LLP, which has committed to a five-year programme of financial support for the Centre totalling £1.4 million.
6.1 Housing and the household balance sheet
Today, with 65% of homes being owner-occupied – just 5% lower than at the peak of home ownership in 2002 when 70% of homes were owner-occupied – it is hardly surprising that considerable media attention is paid to the UK property market and the direction of house prices. For most people, their property is primarily a home rather than an investment – although some people do own properties for investment purposes only, for example to let for rental income. In England, about one-sixth of the 23 million housing stock is privately rented.

Transcript
If you own your home, what were the reasons behind your decision to buy? In this video a range of people offer their stories. What comes across is that owning your own property is a key aspiration in the life course and that it is better than paying money in rent for a property that someone else owns. What also comes across is that property and home ownership are subjects people in the UK are always talking about.
6.1.1 The mortgage market
Buying a property, particularly your first property, usually involves taking out a mortgage – a loan secured against the home.
To guide you through what can seem like a maze of mortgages, here’s personal finance expert Jonquil to explain the six most common types: fixed rate mortgage, variable rate mortgage, capped rate mortgage, offset mortgage, flexible mortgage, shared ownership mortgage.
Transcript
6.1.2 Repaying your mortgage
Another major choice to be made about a mortgage is how to repay it. The options are a ‘repayment’ mortgage or an ‘interest-only’ mortgage (or perhaps a combination of the two).
With a repayment mortgage, the capital or principal sum (the original amount of debt) is paid off in stages throughout the life of the loan. Look at the table below to see the pattern of payments on a repayment mortgage. The typical structure is a reducing balance loan with a set amount paid each month throughout the mortgage term unless the interest rate changes.
The effect of this is that the amount of the principal sum repaid accelerates over the term of the mortgage – initially the majority of annual mortgage costs are made up of interest payments, and then towards the end of the mortgage term these costs are mainly repayments of the principal sum.
One consequence is that a borrower who wishes to repay early might be surprised at how much of the principal sum remains. The table shows a £100,000 repayment mortgage payable over 25 years, at 7% APR with interest calculated monthly. Results will vary slightly if different periods are used – for instance, a daily calculation of interest. Only selected years are shown.
| Year | Interest | Capital | Total repayments for year |
|---|---|---|---|
| 1 | £6736.41 | £1581.05 | £8317.46 |
| 5 | £6245.02 | £2072.44 | £8317.46 |
| 10 | £5410.76 | £2906.70 | £8317.46 |
| 15 | £4240.66 | £4076.80 | £8317.46 |
| 20 | £2599.54 | £5717.92 | £8317.46 |
| 25 | £297.79 | £8019.67 | £8317.46 |
With an interest-only mortgage, the principal sum outstanding is unchanged throughout the life of the loan and only interest payments are made to the lender until the end of the loan period. At the end of the period the borrower must have the means to repay the lender the principal sum. Failure to do this will result in the property being repossessed because it is secured against the debt.
With interest-only mortgages, repayment of the principal is typically achieved by putting money into a savings or an investment scheme (such as an ISA or unit trusts) throughout the life of the mortgage. (In the past, endowment insurance policies were also available to pay off the principal – hence the name ‘endowment mortgage’.)
To determine how much to save each month, the investment is projected to grow at an assumed rate in order to produce a lump sum large enough to repay the principal sum in full on the maturity of the mortgage. Following a reduction in the projection rate in 2000 to reflect changed economic conditions, the market for interest-only mortgages substantially declined, especially for first-time buyers. In October 2010, 93% of first-time buyers took out a repayment mortgage; this compares with 70% before 2007 (BBC, 2010) and just 47% in 1999 (Council of Mortgage Lenders (CML), 2001).
When comparing the interest charges on different mortgage products there are some key points to consider. As you may recall from Week 4, in order to obtain an accurate comparison of the interest charges on different debt products it’s useful to look at the APR quoted. This calculates the cost of the mortgage over its life, taking into account discounts and additional costs (which are not included in the quoted interest rate of the mortgage) as well as the timing of interest payments and charges.
The APR does not include charges for early repayment or options such as insurance or payments into an investment product for an interest-only mortgage. In addition, the APR will not take into account the cost of any mortgage indemnity guarantee (MIG) that might be levied on a higher risk borrower, for example, where the outstanding mortgage is high relative to the value of the property. (The term used to describe the ratio of mortgage to property value is ‘loan-to-value’, or LTV.) Provided the products are comparable (for example, all repayment mortgages), a low APR indicates that a mortgage is cheaper than one with a higher APR.
To help the process of making decisions in such a complex mortgage market, the UK’s financial regulator for this area has stipulated that each mortgage seller must provide a Key Facts Illustration (KFI). This document is produced as part of the mortgage application process, and includes details of the features, terms and conditions of the mortgage product to enable borrowers to compare different products on the same basis.
Included in the KFI is information on the overall cost of the mortgage, the amount of regular repayments, the APR and whether there are any early redemption penalties. The KFI also illustrates by how much monthly mortgage repayments would rise if there were a 1% increase in the rate of interest on a variable rate mortgage.
The introduction of the KFI can be seen as an example of regulators responding to the complexity that accompanies increased competition, in this case by insisting that lenders provide information to enable mortgage customers to compare products more easily.

6.1.3 The costs of buying a home
Once you’ve chosen a mortgage, it has to be applied for and the home purchased. This is equivalent to the ‘Stage 3 Act’ part of the financial planning process. In addition to the deposit, this is where homebuyers rack up other bills as well.
To show you how these costs may add up, let’s suppose you’re buying a property for £200,000. What costs do you incur?
- Mortgage arrangement fee (common with fixed rate, capped and discounted mortgages): say, £500.
- Legal costs including local searches and Land Registry fee: £800.
- Survey and valuation: £350.
- Stamp Duty Land Tax (SDLT): £1500. SDLT applies in England and Northern Ireland. It is charged at a graduated rate – 0% on the first £125,000 of the property price, 2% on £125,000 to £250,000 rising in steps to 12% on the amount of the purchase price above £1.5 million. In the 2017 Budget Statement it was announced that first-time buyers of residential properties costing up to £300,000 would be exempt from SDLT. This also applies to the first £300,000 on properties priced up to £500,000 in certain ‘expensive’ parts of the country. The equivalents to SDLT are Land and Buildings Transaction Tax in Scotland and Land Transaction Tax in Wales.
- Removal costs: say, £700.
- GRAND TOTAL: £3850.
There may also be a fee to the mortgage broker if you’ve used one to help choose and organise the mortgage. But more often the broker is paid by commission from the mortgage provider and this is ultimately borne by the borrower through charges for the mortgage.
The largest cost will be the price of the property itself, which you, the buyer, can try to negotiate down from the seller’s ‘asking price’. Once a price has been agreed, both parties approach their solicitors (or other conveyancer) to seek completion of the transaction.
Is the agreed price binding? In Scotland, the buyer submits their offer to the seller by an agreed date and the seller selects the best offer. Usually, at this point, the price agreed is binding so the mortgage needs to be arranged before the offer is made.
In England, Wales and Northern Ireland, until the legal contracts are ‘exchanged’ between the two parties, both the buyer and the seller are able to seek to change the price originally agreed and even to pull out of the deal without penalty. Sellers may accept a new, higher offer up to the point when contracts are exchanged – an unpopular process known as ‘gazumping’ – but if the market is weak there is the risk of ‘gazundering’, where the buyer cuts the level of their offer at the last minute.
The exchange date is particularly important if there is a long ‘chain’ of sales involved. Usually buyers and sellers in a chain of housing transactions coordinate to try to ensure that no one remains committed to buying a property without having secured a commitment to have their existing property bought. The longer the chain, the greater the risk of problems that will prevent completion of the individual transactions.
When the documentation is agreed and exchanged, the buyer pays a deposit to the seller and a ‘completion date’ is agreed, when ownership passes legally from the seller to the buyer and the money is paid. This is also usually moving day.
One decision that needs to be made if two people are going to buy together (whether as partners or not) is how the property will be owned legally. For instance, if they own it as joint tenants, each jointly owns the entire property, so upon the death of one party their interest in the property would pass automatically to the survivor. Therefore, couples will usually buy a property as joint tenants.
By contrast, tenants-in-common each have a distinct share in the property. In Scotland, the equivalent terms are joint owners and owners-in-common. However, in Scotland, joint owners will have to have a ‘survivorship destination’ clause in the deeds to determine what happens to the property if one of the joint owners dies.

6.1.4 How much does it cost?
This quiz tests your ability to calculate the costs of buying a home.
Activity 1
a.
£150,000
b.
£153,250
c.
£152,750
d.
£150,500
The correct answer is b.
b.
Well done. The total costs are as follows:
Cost of property £150,000
Stamp Duty Land Tax (£25,000 x 2%) = £500
The other costs are £500 + £250 + £750 + £250 + £1000 = £2750
The total cost of buying the property is therefore £150,000 + £500 + £2750 = £153,250
a.
2.17%
b.
2.76%
c.
0.28%
d.
3%
The correct answer is a.
a.
Well done!
The extra costs are (£3,250 /£150,000) × 100 = 2.17% on top of the cost of the property.
6.1.5 Leasehold and freehold – some facts
Do you know the differences between leasehold and freehold? These are terms that are used every day in the property market world.
In this audio Martin sets out the basics, and gives you the heads up on the pros and cons of each.
Transcript
6.2 Selling property, re-mortgaging and housing as an investment
Once you’ve entered the property market, moving home commonly involves both buying a new property and selling your existing one. In these circumstances you’ll need to manage carefully the timing of the exchange process – the formal agreement to buy or to sell a property – to make sure you don’t end up owning two properties while desperately trying to sell one of them. If it’s not possible to synchronise the sale and purchase dates, there are bridging loans designed to supply the necessary funds until the situation is resolved.
Another possibility is to sell your property and allow a gap before buying another. You risk being priced out of the market if property prices are rising, but this is a sound strategy if prices are flat or falling.
What are your principal considerations when you’re a seller? First, you’ll want to achieve as high a price as possible, and TV shows give endless tips about making homes attractive to buyers.
A practical consideration, unless you’re selling at auction, is to decide how to sell and how many estate agents to engage in the process. Typically, selling commission is between 1% and 3% of the sale price. If you’re using one agent only (a ‘sole agent’), it may be easier to negotiate the estate agent’s commission than if several agents are used.
Selling without agents, using instead the media and the internet, is an alternative. Sellers in Scotland have to provide a home report which includes energy details and a survey. In England and Wales, sellers are obliged to provide an energy performance certificate.
Legal costs will be higher when both buying and selling since there’s more documentation to be completed.
One important final point if you’re selling your home – any profits you make by selling for a higher price than you paid when you bought it are not subject to tax. By contrast, if you make a profit on the sale of a property that is not your home – for example one that you’ve been renting to tenants – then you will be subject to Capital Gains Tax (CGT).

6.2.1 Mortgages – the risks
Figure 4 shows the numbers of properties in the UK that were repossessed by lenders between 2008 and 2016. This occurs when those buying a property with a mortgage find themselves unable to meet the repayments required.
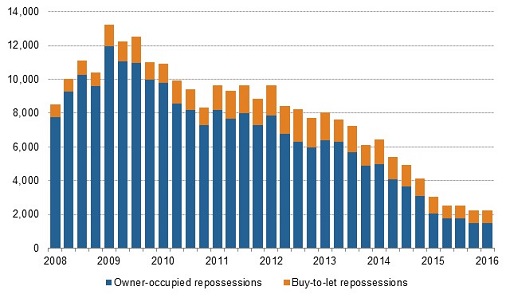
The reality of repossessions demonstrates a key risk involved when buying a property. You have to ensure that you can always make your mortgage payments. If you cannot do so, you risk losing your home.
The pattern of repossessions also demonstrates the links between the housing market and the wider economy. The high points in the repossession cycles in the early 1990s and late 2000s occurred when the economy was in difficulty, with unemployment increasing or with interest rates at high levels. Unemployment and high interest rates are two reasons why households become unable to pay their mortgages. If either of these happens for a sustained period, repossession then takes place.
The lender will often allow some leeway involving a small number of missed payments, provided they are advised of what the borrower believes to be a temporary problem. However, if payments are missed for a sustained period the lender is likely to take action, including as a last resort repossessing the property.
While some pressure has been applied to lenders by the government to act with consideration when borrowers fall behind with their payments, at the end of the day a mortgage is a secured loan. If the repayments are not met, the security (that is, the property) will be taken by the lender.
One way of protecting yourself is to take out Mortgage Payment Protection Insurance (MPPI), also known as accident, sickness and unemployment insurance (ASU). This usually covers the repayment of interest (but not capital) if you are unable to work because of accident, sickness or redundancy. Typically, a period of up to two years’ cover on mortgage repayments is insurable, but because of exclusions this type of insurance is not suitable for everyone.
The government may also assist through schemes to help people stay in their homes, for example by switching to renting part or all of their home or, for those on certain benefits, through help with mortgage interest payments.
Will your investment plan pay off your mortgage?
Another risk is that the savings or investment vehicle used to pay off the principal sum in interest-only mortgages produces insufficient money. Investment policies sold in the late 1980s and 1990s were based on assumptions about future investment performance that turned out to be too high.
Low inflation and interest rates since the early 1990s, and the periodic weakness of certain of the world’s stock markets, mean that some borrowers are at risk of finding that the principal sum of their mortgage cannot be paid off by the proceeds from their investment product. This is particularly true if borrowers did not regularly review how much they were setting aside.
This highlights the importance of the ‘Stage 4 Review’ part of the financial planning process: in this case, reviewing the progress of the investment regularly and making adjustments if the investment is unlikely to repay the loan in full. Sellers of the investment products should advise you about this risk when you take out such a mortgage, and should follow up with regular re-projections of how the product is performing.
Options if your investment plan is under-performing
If the risk looks as though it will materialise, you have the following options:
- increase monthly payments on the investment product to increase the projected earnings by the maturity date of the investment
- increase savings by paying extra into a different investment product, which then supplements the original
- move to a repayment mortgage for some or all of the outstanding debt
- find additional resources when the mortgage reaches the end of its term; this could include borrowing again to meet the outstanding debt
- switch from the original product into another, although this is likely to incur penalties
- sell another asset or perhaps use a lump sum paid from a pension scheme.
Investment products can produce a return that exceeds the principal sum. Recent policies have seen projected shortfalls, but older policies have often produced returns in excess of the principal sum of the mortgage, since these benefited from the higher investment yields seen in the 1980s and the early 1990s, and from tax reliefs that have now been abolished.
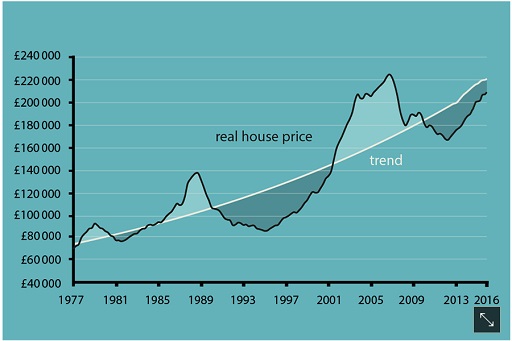
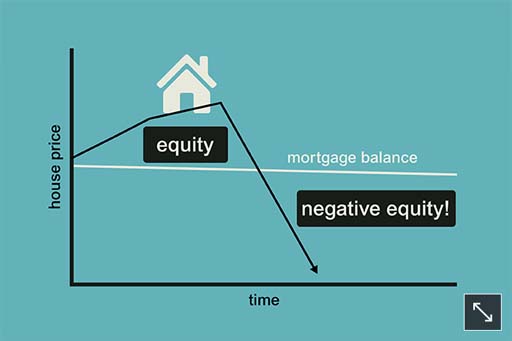
Another risk is that of negative equity. House prices fell between 1989 and 1995, declined again during the period from 2008 until the start of 2013, and could do so again in the future.
Many of those who bought houses at the peak of the market found themselves in a situation of negative equity, where the size of the mortgage debt exceeded the market value of their property. Moving into negative equity is not critical if the borrower is still able to meet their mortgage repayments and does not have to move home.
However, if moving is necessary and house prices have fallen, there is the risk that the sale proceeds will be less than the amount owed on the mortgage. Either the shortfall has to be made up from other resources (for instance, savings or a loan) or it has to be added to the size of any new mortgage on a new property – provided the lender agrees to this.
Some mortgage lenders, particularly during the housing boom of the 2000s, offered mortgages of more than 100% of a home’s value. What issues should you consider before taking out such a mortgage?
For some people, this kind of mortgage will enable them to buy a property that they otherwise could not buy. However, anyone taking on a debt for a sum greater than a property’s value should be aware that they will immediately be in negative equity. This means that if they want to move home in the future, they will have to finance the difference between the total debt and the property’s value, or gamble on house prices rising.
A further risk of having a mortgage is that the mortgage ends up costing more than it needs to. It is possible, even if the best available mortgage was arranged at the time of purchase, that either circumstances have changed or other mortgage deals have become available – such as if a fixed rate product is taken out and interest rates subsequently fall.
6.2.2 Financial planning when buying a home
You’ve now considered the main steps involved in buying a property. Here you see what Heather has to do to achieve her goal of buying her first home using the financial planning model that you first met in Week 1.

Transcript
6.2.3 Remortgaging
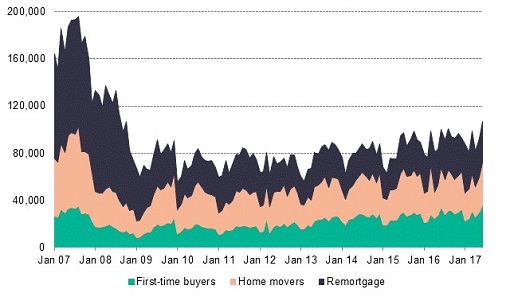
Increased competition in the mortgage market has increased the popularity of ‘remortgaging’. This involves repaying an existing mortgage and taking out a new mortgage at a lower rate, from either an existing or a new lender.
Remortgaging may come about after a regular review of household finances or could be triggered by changes in household income, by changes in interest rates or by the end of being locked into a particular mortgage contract.
Remortgaging might seem simple, but there are costs. In addition to legal costs, there may be ‘early redemption’ or ‘prepayment’ fees. Generally these fees last for the first few years of the mortgage, or the period of any special deals, but sometimes they extend beyond a special deal (called a tie-in).
The terms of early redemption fees will be included in the KFI. When repaying a longer term, fixed-rate mortgage early, the prepayment fees may be substantial – a fee of six months’ interest is not uncommon.
This does not necessarily mean that remortgaging might not save money, particularly if interest rates have fallen a long way since the initial mortgage was arranged. It simply means that households need to make careful comparisons.
Any savings made from remortgaging will help with the budgeting process you explored earlier in the course. Stop and think about this next.
6.2.4 Remortgaging – a few sums
Activity 2
For the purpose of this activity let’s keep things simple by considering an interest-only mortgage – the sums for a repayment mortgage will be a bit different but will follow the same principle.
Assume the fixed rate deal on a 25-year interest-only mortgage of £100,000 ends in three years.
- Currently the Barnett household is on a fixed rate deal at 5% p.a. If they repay now, the lender will charge an upfront six-month interest penalty.
- They have savings earning 2% p.a. net interest, which could cover this cost, and another lender has offered them a three-year mortgage at 3% p.a. and will cover all the other costs of remortgaging.
Should the Barnetts pay the penalty and remortgage?
Discussion
The calculation goes like this.
The six-month penalty costs the Barnetts 2.5% = (5% for half a year), which is £2500 = (2.5% of £100,000).
If they keep the £2500 invested at 2% for three years, leaving the interest in the account, this will total £2,653 at the end of the three years. This is because the interest would be compounded (you learned about compounding in Week 4).
The calculation is:
(£2500 × 1.02 × 1.02 × 1.02) = £2653
The annual savings with the new lender are:
5% - 3% = 2%.
For each year, the household would save £2000 = (£100,000 × 2%), totalling savings of £6000 over three years.
So, even if the Barnetts do not invest the annual sum saved, the minimum benefit from remortgaging is £6000 - £2653 = £3347, implying that the financially capable household should remortgage.

6.2.5 Housing as an investment
Throughout much of the 2000s, property was considered a serious alternative to other kinds of investment. Driven by the liberalised financial services sector, which made mortgages easy to obtain, and a boom in house prices, property was seen as a one-way bet. When property prices began to decline in 2008, investing in property for capital gain began to look like a more uncertain strategy.
This is not to say that you should overlook the investment in your own home. It’s easier to raise finance on the ‘primary residence’ than on second homes; there’s only one set of interest costs to worry about and there’s normally no liability for Capital Gains Tax on any profit made. The objective with your home (apart from having somewhere to live) would be to increase its capital value and so the equity in it. There are several ways in which that can happen over and above any general rise in property prices.
Homes can be bought in an ‘up and coming’ area where property prices will rise more than the average; they could be bought at below the ‘true’ market value; or someone can add value to a property by finding, for instance, a rundown home suitable for refurbishment and, when completed, sell at a profit over and above the total cost of the purchase, interest and refurbishment.
The video, from October 2013, explores the way in which the purchase of property as an investment has continued to be popular and to have a significant impact on property prices, particularly in areas like London.

Transcript
Another way to make money from a home is to rent out a spare room, effectively using the home as an income-producing asset. Some people carry these ideas substantially further and rent out several rooms, or regularly buy, develop and then sell individual properties. Doing either would move into the realms of trading, and as a result both Income Tax ‘Rent-a-Room’ relief and Capital Gains Tax exemptions would be lost.
6.2.6 Spotting the risks
The risks of letting out an investment property include:
- property prices falling – something that can and does happen when economic activity is weak
- the landlord being unable to find tenants for the rental property for a period of time
- higher than anticipated costs on the property (for instance, on maintenance or renovation).
These risks reinforce the need for careful calculations and expert advice.
6.3 The household balance sheet
In this section, you will look at how to build the household balance sheet and calculate net worth, the current asset ratio and gearing. You will then find out how to link the balance sheet to the household budget.
Now you’re ready to explore the household balance sheet more fully. This gives an individual or a household a snapshot of their overall financial position at a particular point in time. It also gives clues to how vulnerable the household may be to the financial impact of future shocks. Such information, taken together with cash flow and budgeting statements, is crucial for financial planning.
Take a look at the household balance sheet in your fact find. Let’s take a tour of its components before you start to fill it in with your own details.
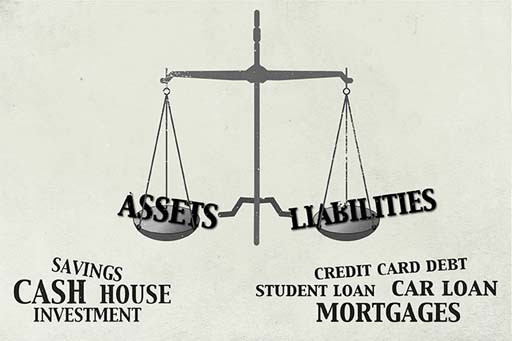
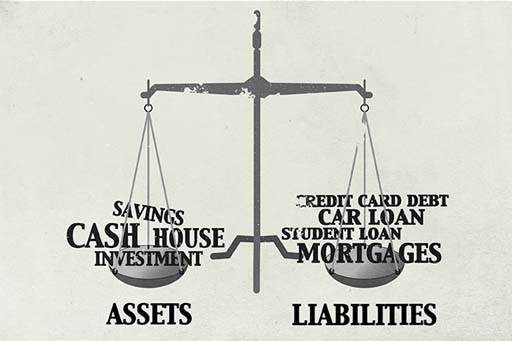
It lists the main items recorded in a financial balance sheet, and most of these items should now be familiar to you. Assets are split between liquid assets and other assets, while liabilities are split between short-term and other liabilities. The difference between total liabilities and total assets provides an estimate of the net worth (or wealth) of an individual or a household – rather like a summary of their overall financial position at a particular point in time.
Note that net worth is estimated rather than a precise calculation, because it can be difficult to obtain an accurate valuation of certain assets without actually selling them. For example, the value of a house can be estimated, but its actual value will depend on a price obtained in the marketplace.
You may also notice that contributions to pension schemes are not included in the assets column. This is because, generally, pensions cannot be sold, cannot be accessed before age 55 and, with some, they are promises of future income rather than pots of savings, making it hard to get a meaningful estimate of their worth. (Pensions are considered separately next in Week 7.)
Despite these reservations, the estimate of net wealth provided by the household balance sheet is useful in giving an overview of an individual’s or a household’s financial position.
Later you’ll look at other calculations related to the household balance sheet – the current asset ratio and gearing – and how these can help with financial planning.
6.3.1 Completing your household balance sheet
Now complete your household balance sheet in your fact find as far as total assets, total liabilities and net worth. As you’re aware, you can do this individually or for your household – whichever you feel is appropriate. To do this you need to access your most recent bank account and credit card statements, and, if you’re an owner-occupier, your mortgage account. For certain of your assets, particularly your home or car, you’ll have to make an estimation of their current value. There are websites that can help you do this.
Don’t get overly stressed about getting valuations to the nearest pound. A rough estimate is perfectly good enough.
When you’ve done this you can determine your current net worth (or wealth) by deducting total liabilities (H) from total assets (G).
6.3.2 Targeting the current asset ratio
The household balance sheet can also be used to calculate the current asset ratio. This compares total liquid assets with total short-term liabilities and is useful in assessing how finances can be managed in the short term. It is calculated in the following way:
Current asset ratio = Total liquid assets / Total short-term liabilities
Personal finance experts say that the current assets ratio should always exceed 1. If it is below 1, then that tells us that short-term liabilities (such as bills and credit card debts) could not be met if circumstances made it necessary to do so. This can indicate that potentially serious financial difficulties could lie ahead. The risks are insolvency and potentially even bankruptcy.
Personal finance experts often argue that a good target to aim for – when well into adult life – would be a current asset ratio of 4, though a less conservative target might be only 3.
Now use the figures you’ve produced on your household balance sheet to calculate your current asset ratio by dividing total liquid assets (C) by total short-term liabilities (D). How might this be used in financial planning?
One possible use of your current asset ratio would be to assess the progress of particular financial plans. Someone with the goal of getting out of short-term debt, for example, could calculate their current asset ratio every three months and track it as it (hopefully) moves to a figure above 1.

6.3.3 Your household balance sheet – gearing
Another important balance sheet ratio is gearing, which is usually worked out as a percentage and is simply:
Gearing = Total liabilities / Total assets × 100
You may have heard a lot in the news about whether government debt levels are too high and need to come down. In the same way, household debt levels can be too high as well. Why does it matter?
Consider the two household balance sheets. Use the formula to work out the gearing for each household. Then assume that house prices fall by 20%. Adjust the balance sheets for the new lower property values and comment on how each household has weathered this shock.
| LIQUID ASSETS | £30,200 |
| OTHER ASSETS | |
| Home | £435,000 |
| Other | £132,000 |
| TOTAL ASSETS | £597,200 |
| SHORT-TERM LIABILITIES | £5400 |
| OTHER LIABILITIES | |
| Mortgage | £62,000 |
| 3-year car loan | £6500 |
| TOTAL LIABILITIES | £73,900 |
| LIQUID ASSETS | £2050 |
| OTHER ASSETS | |
| Home | £180,000 |
| Other | £30,000 |
| TOTAL ASSETS | £212,050 |
| SHORT-TERM LIABILITIES | £3800 |
| OTHER LIABILITIES | |
| Student loans | £9400 |
| Mortgage | £164,000 |
| TOTAL LIABILITIES | £177,200 |
Looking at your own household balance sheet, you can now have a go at calculating your gearing using the guidance set out above.
Why do you think measuring gearing can provide an insight into how exposed to risk your household balance sheet is?
6.3.4 Can gearing predict a crisis?
Let’s start by looking at what happens if house prices fall by 20%. Both households will see the value of their assets fall but there is no change to their liabilities:
- The Sterling family’s home falls in value from £435,000 to £348,000 (which is 80% of £435,000). This is a big drop but the household still has net worth of £436,300 and so still has a large cushion against further shocks. The Sterlings probably do not have to make any immediate changes to their finances.
- The Penny family’s home falls in value from £180,000 to £144,000 (which is 80% of £180,000). This leaves them with negative net worth of -£1,150. Moreover, their house is now worth less than their mortgage. The Pennys now have very little scope to cope with further shocks, such as job loss or a major expense, and they cannot afford to move home if they need to.
Could these very different impacts of the same shock on these two households have been predicted? Consider the gearing of each household before the 20% fall in house prices:
The Sterling household has a gearing of £73,900 / £597,200 = 12.4%.
The Penny household has a gearing of £177,200 / £212,050 = 83.6%.
The much higher gearing of the Penny household is a clear indicator that they may be more vulnerable to shocks than the Sterlings. While there is no hard and fast rule about what is a ‘good’ gearing, you should be aware that the higher the ratio, the greater the financial risk to the household.
6.3.5 Linking the balance sheet to income and expenditure
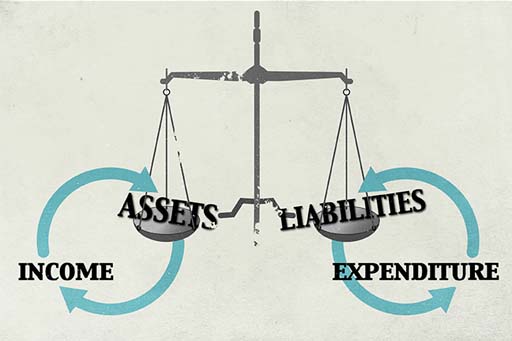
Let’s end this week by looking at the relationship between liabilities and expenditure, and assets and income.
This is summarised in the image, which describes the inter-relationship between the stocks of assets and liabilities and the flows of income and expenditure. Assets are on one side of the scales and liabilities on the other.
In reality, these scales would be in constant motion, as money continually flows into and out of individuals’ and households’ pockets, and the value of assets and liabilities is continuously changing. For the sake of simplicity, assume the scales have stopped at a particular point in time. This allows an exploration of both how assets relate to income and how liabilities relate to expenditure.
The receipt of income adds to the asset side of the household balance sheet (at least in the short term) as money flows, such as pay from employment, go into a current account. Alternatively, income can be used to purchase shares, bonds or other forms of saving and investments. In turn, many assets produce flows of income, such as interest payments or share dividends.
Non-financial assets (for instance, a piece of art) generally do not produce an income flow, and would have to be sold to generate money. Yet even these assets could theoretically produce an income, for example, lending a work of art to an exhibition for a fee.
Similarly, expenditure is related to liabilities in the sense that having debts generates future flows of expenditure. Expenditure either reduces assets – perhaps by depleting the current account or by causing other assets to be sold – or increases liabilities, perhaps by taking out debt to pay for it. Expenditure that is higher than income generates liabilities because individuals or households will have to take on debts, for example, by using credit cards or overdrafts, to fund the gap between expenditure and income.
To return to the subject of housing, it can be interesting to consider how homes fit into the household balance sheet. Homes are typically regarded as the biggest asset of an individual or household. Yet an interesting point put forward by Robert T. Kiyosaki in his famous book Rich Dad, Poor Dad: What the Rich Teach their Kids about Money – that the Poor and Middle Class Do Not! (Kiyosaki, 2011) is that one of the key mistakes contributing to making people ‘poor’ rather than ‘rich’ is buying a home that is bigger than strictly needed.
Rather than buying assets that produce income (like shares or investments), the large mortgage actually causes expenditure to escalate. It’s a salient point, which provides an interesting counterweight to the British dedication to house buying.
Week 6 quiz
This quiz allows you to test and apply your knowledge of the material in Week 6.
Complete the Week 6 quiz now.
Open the quiz in a new window or tab then come back here when you're done.
Week 6 round-up
In Week 6 you looked at the most important financial asset most households possess – their home.
You examined the processes and issues involved in buying and selling property, and at the mortgage products that are commonly used to fund property purchases. You also examined the ‘buy-to-let’ market and the range of risks involved in buying and owning property.
Household balance sheets provide a snapshot of individual or household net worth and are an important tool in personal financial planning. This tool adds to the cash flow statement and budgeting processes explained in Weeks 2 and 3, and together these offer a crucial tool kit in financial planning and money management.
The size and composition of the financial balance sheet is also very important as you become older – it will affect how you approach retirement planning, a subject you will look at next.
You can now go to Week 7: Pensions

References
Acknowledgements
This unit was written by Martin Upton and Jonquil Lowe.
Except for third party materials and otherwise stated in the acknowledgements section, this content is made available under a Creative Commons Attribution-NonCommercial-ShareAlike 4.0 Licence.
The material acknowledged below is Proprietary and used under licence (not subject to Creative Commons Licence). Grateful acknowledgement is made to the following sources for permission to reproduce material in this unit:
Unit image
Figures
Figure 1 ©iStockphoto.com/stevecoleimages
Figure 2 contains artwork ©Anthony Seldon
Figure 3 © iStockphoto.com/fazon1
Figure 6 © iStockphoto.com/georgeclerk
Figure 7 © iStockphoto.com/dlewis33
Figure 10 © iStockphoto.com/whitemay
Every effort has been made to contact copyright owners. If any have been inadvertently overlooked, the publishers will be pleased to make the necessary arrangements at the first opportunity.
You can now go to Week 7: Pensions
Don't miss out:
1. Join over 200,000 students, currently studying with The Open University – http://www.open.ac.uk/ choose/ ou/ open-content
2. Enjoyed this? Find out more about this topic or browse all our free course materials on OpenLearn – http://www.open.edu/ openlearn/
3. Outside the UK? We have students in over a hundred countries studying online qualifications – http://www.openuniversity.edu/ – including an MBA at our triple accredited Business School.