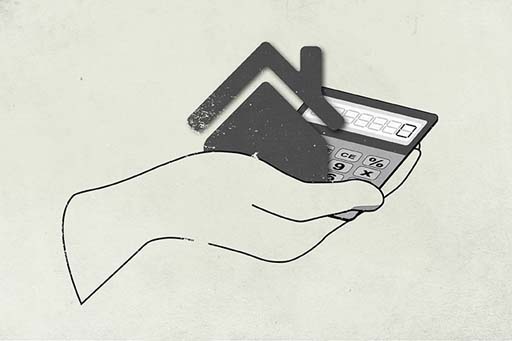
Week 3: Expenditure and budgeting
Use 'Print preview' to check the number of pages and printer settings.
Print functionality varies between browsers.
Printable page generated Sunday, 19 May 2024, 10:28 AM
Week 3: Expenditure and budgeting
Introduction
The previous week was about incomes; now you turn to household expenditure. Bringing the two together enables you to build a budget. Look at more budgetary challenges and at how spending links to lifetime goals.
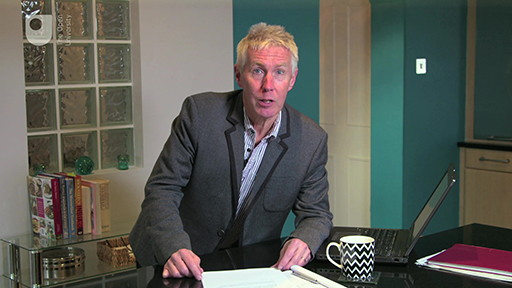
Martin introduces the week, which examines household expenditure and shows you how, by combining expenditure and income, you can compile a budget.
Transcript
Once again you use the MAS budget planner to assist you in filling in the relevant parts of your fact find.
This course is presented with the kind support of True Potential LLP.
The True Potential Centre for the Public Understanding of Finance (True Potential PUFin) is a pioneering Centre of Excellence for research in the development of personal financial capabilities. The establishment and activities of True Potential PUFin have been made possible thanks to the generous support of True Potential LLP, which has committed to a five-year programme of financial support for the Centre totalling £1.4 million.
3.1 What are your spending habits?
Do you spend only what you need for your household to function? What factors influence your spending habits? To what extent are you aware of social pressures that affect the level and composition of your household expenditure?

Transcript
3.1.1 Budgeting – the basics
For most people there’s considerable pressure to spend money on goods and services, yet we all need to avoid debt, to save and to invest for the future. The process of budgeting can help to reconcile competing demands on income. A budget identifies and adjusts income and expenditure flows. It looks forward, to estimate and plan income and expenditure over a future time period.
So how does setting a budget help you manage your household finances?
- It helps you control spending by comparing your income with your spending.
- It helps you check that you have enough spare income to pay current and future bills without having to borrow.
- It enables you to plan on how to meet your goals.
Carrying out a budgeting exercise once is useful to help you to assess whether your spending is under control, but budgeting is most effective in managing finances when you use it as part of an ongoing process.
Next, you see how an income and expenditure profile sheds light on the financial circumstances of a young woman called Jenny.

3.1.2 Meet Jenny
Jenny is a 28-year-old woman who works as an insurance clerk.

Transcript
Next you’ll be taking a look at her expenditure and net income between 2006 and 2018.
3.1.3 Jenny's profile
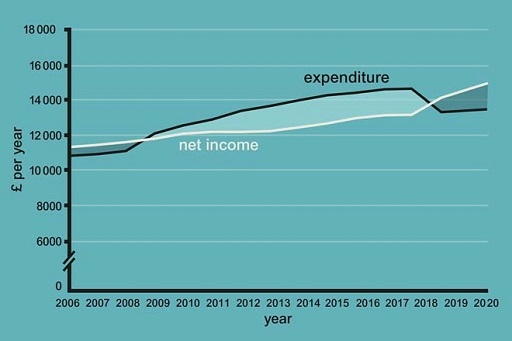
Figure 2 shows both Jenny’s net income and her expenditure but the thing to note is her net income as that is what matters most for budgeting purposes. In order to think about planning expenditure, an individual or household needs to know how much income they have available to spend, save, invest or to pay back borrowing.
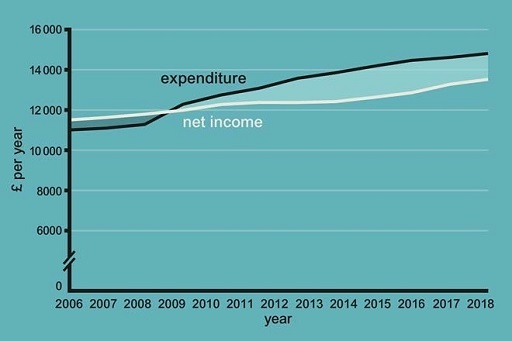
Gross income does not provide this information because Income Tax and other deductions are not taken into consideration, whereas net income takes such deductions into account. For the same reason, the income side of the budget, in Week 2, showed net income.
You can see that since 2009 Jenny’s expenditure has been higher than her net income. From 2009 the gap between the two lines shows the amount that Jenny is spending over her income, and the shaded area from 2009 to 2018 between the two lines gives the total amount that she’s spent above her net income.
In such a situation, Jenny will have had to borrow to pay for this excess expenditure, unless she had savings to draw on. Between 2006 and 2009, when her net income was higher than expenditure, Jenny will have accumulated some savings, but these are not enough to prevent her having to borrow in the later period when she spends more than her income.
Assuming Jenny doesn’t want to accumulate larger debts, she needs either to increase her income or to reduce her expenditure, or both: effectively, she would like to move her income line up and/or her expenditure line down. If she manages to do this sufficiently (and budgeting is one way to achieve this aim), in the future she will be in a position where her expenditure no longer exceeds her income.
The graph shows Jenny’s total net income and total expenditure per year. This is useful because it gives Jenny a clear picture of what’s happening to her finances over time and provides an idea of why she might need to make changes in the future.
Budgeting can help you to plan such changes by looking at the details of your income and expenditure. This requires you to examine your income and expenditure flows over a shorter time horizon than a year, usually as often as income comes in (weekly or monthly), and then to project the flows forward to work on an annual level and beyond.
This example highlights the dual functions of a budget:
- first, it can be used to achieve the immediate goal of managing your money on a short-term, day-to-day basis
- second, it is vital for planning ahead to help ensure that your medium- and long-term goals – like coping with higher education fees and having sufficient money to retire – can be achieved.
3.1.4 Jenny’s budget (Stage 1: assess the situation)
As you’ve already identified, Jenny is spending more than her income and needs to get her money management under control. This is Jenny’s immediate purpose in preparing her budget.
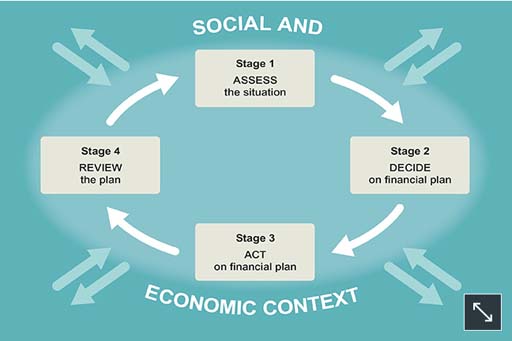
The approach to budgeting that you start here is once again the four-stage financial planning model. The start of the budgeting process could be described as the ‘reality check’, beginning with a cash flow statement.
| Cash flow (£ per month) | Average month (£ per month) | Budget (£ per month) | ||||
|---|---|---|---|---|---|---|
| NET INCOME | ||||||
| Earnings | Total 1115 | Total 1115 | Total 1115 | |||
| TOTAL NET INCOME | 1115 | 1115 | 1115 | |||
| Rent | 250 | 250 | 250 | |||
| Council Tax | 50 | 50 | 50 | |||
| Regular bills (gas, electricity, water, etc.) | 30 | 60 | 50 | |||
| Telephone (mobile and landline) | 40 | 40 | 30 | |||
| Home insurance (contents and building) | 12 | 12 | 10 | |||
| Household goods | 15 | 30 | 30 | |||
| Food and non-alcoholic drinks | 150 | 150 | 120 | |||
| Alcohol | 40 | 40 | 40 | |||
| Tobacco | 30 | 30 | 0 | |||
| Clothing and footwear | 50 | 50 | 40 | |||
| Medicines, toiletries, hairdressing (personal) | 30 | 30 | 30 | |||
| Going out | 120 | 120 | 80 | |||
| Holidays/other leisure | 20 | 100 | 50 | |||
| Motoring costs (insurance, petrol) | 70 | 130 | 180 | |||
| Birthday presents/charity/other gifts | ||||||
| Christmas presents/gifts | 10 | 45 | 30 | |||
| Personal loan repayments | 100 | 100 | 100 | |||
| TOTAL EXPENDITURE | Total 1017 | Total 1237 | Total 1090 | |||
| SURPLUS/DEFICIT | 98 | -122 | 25 | |||
Last week you looked at the income flows of a household. Now, the expenditure side of the cash flow statement will be added to see whether expenditure is less than, more than, or equal to income.
This statement provides a snapshot of the income and expenditure of a household during a particular week or month. A month is the time period used here for Jenny’s budget, but the process is the same whatever period is chosen. When you’ve added expenditure you’ll look at why this cash flow statement might not be giving the whole picture.
A system of keeping and carefully filing all bank and credit card statements will help you to collect information on how your money is being spent: in other words, you will have a record of all your debit card transactions, direct debits, standing orders, and goods and services bought on credit. However, to obtain a full picture of how your money is being used, it’s a good idea to keep a spending diary that records all cash transactions.
Once all such information about expenditure has been collected, you need to classify it under different headings of expenditure. The level of detail to include and how broad the headings under which expenditure is classified are personal choices. Nevertheless, it’s important to have some different headings if the budget is to be useful when thinking about change.
Individual circumstances will influence this decision, as well as the amount of detailed information available to record transactions. For instance, if you go out frequently, you may want to have a detailed set of headings for specific areas of ‘going out’ – such as meals out, cinema, the pub, lunch, going to football … Amounts under the different headings can then be recorded on the cash flow statement, alongside the income section described in Week 2.
In the table you can see the various parts of budgeting on one sheet. For convenience, it groups all three parts as three columns together: the first shows the cash flow statement for a particular month, the second shows average monthly expenditure and the third shows the budget. Start by considering Jenny’s cash flow statement for May 2018 – the first column.
The income side of the cash flow statement for Jenny is straightforward, as her only income is from her salary. If she had other earnings or you were considering a household with more than one person, then there would be different sources of net income, which should all be recorded.
Jenny’s cash flow statement doesn’t seem quite as bad as might have been anticipated from the graph, which showed expenditure being consistently higher than income for several years. In fact, in May 2018 she has a surplus of £98. You know this because her net income was £1115 and her expenditure was £1017, leaving £98.
How accurate is Jenny’s cash flow statement?
Take another look at Jenny’s cash flow statement. Can you think why it might not give an accurate picture of how Jenny spends her money over a whole year?
3.1.5 The budget – the average month
The information in the cash flow statement shows one month only. May 2018 may not be a typical month. There will be some commitments that only come up every so often, such as road tax, quarterly bills, TV licence and other occasional spending such as going on holiday, buying a new piece of furniture or buying Christmas presents. This is why people can sometimes underestimate their spending. For budgeting, an ‘average’ or ‘typical’ month is needed.
| Cash flow (£ per month) | Average month (£ per month) | Budget (£ per month) | ||||
|---|---|---|---|---|---|---|
| NET INCOME | ||||||
| Earnings | Total 1115 | Total 1115 | Total 1115 | |||
| TOTAL NET INCOME | 1115 | 1115 | 1115 | |||
| Rent | 250 | 250 | 250 | |||
| Council Tax | 50 | 50 | 50 | |||
| Regular bills (gas, electricity, water, etc.) | 30 | 60 | 50 | |||
| Telephone (mobile and landline) | 40 | 40 | 30 | |||
| Home insurance (contents and building) | 12 | 12 | 10 | |||
| Household goods | 15 | 30 | 30 | |||
| Food and non-alcoholic drinks | 150 | 150 | 120 | |||
| Alcohol | 40 | 40 | 40 | |||
| Tobacco | 30 | 30 | 0 | |||
| Clothing and footwear | 50 | 50 | 40 | |||
| Medicines, toiletries, hairdressing (personal) | 30 | 30 | 30 | |||
| Going out | 120 | 120 | 80 | |||
| Holidays/other leisure | 20 | 100 | 50 | |||
| Motoring costs (insurance, petrol) | 70 | 130 | 180 | |||
| Birthday presents/charity/other gifts | ||||||
| Christmas presents/gifts | 10 | 45 | 30 | |||
| Personal loan repayments | 100 | 100 | 100 | |||
| TOTAL EXPENDITURE | Total 1017 | Total 1237 | Total 1090 | |||
| SURPLUS/DEFICIT | 98 | -122 | 25 | |||
A budget has to include all expenditure – it’s very important that irregular expenditure or occasional items are included. This is normally achieved by recording the amount of any such payment, and the frequency at which it occurs, and recalculating it as an equivalent monthly figure. For example, if electricity charges are £180 for a year, this is recalculated as a monthly figure of £15 (£180 per year, divided by 12 months). If Jenny spends £600 on a holiday once a year, then this would equal £50 per month.
Similarly, if, in the month of recording the cash flow statement, Jenny were to undertake a once-a-year expenditure, this would need to be annualised, which would reduce the monthly expenditure figure by spreading that sum across all 12 months. Starting with a cash flow statement and averaging out the more infrequent expenditure should produce a reasonably accurate picture of current income and expenditure per month.
An additional point to be wary of is double counting when using a credit card for a purchase. Suppose you buy a television for £500 using your credit card, and record the purchase as an expenditure item of £500 in that month’s cash flow statement. If, in the following month, you pay off your credit card in full, you might record the £500 a second time as a credit card payment: that is, you’ve counted it twice even though you’ve only spent £500.
One possible option is to add an additional column in your cash flow statement that itemises credit card purchases, so you can track what you’re spending money on, but only record the payment being made once you’ve paid off the purchase on your credit card.
Another option is to have a series of subcategories under credit card purchases that itemise what you’ve bought on the credit card. Whichever technique you use, make sure you regularly update and review your cash flow statement, ensuring that items are only recorded once.
Jenny’s average monthly expenditure and net income are shown in the second column in the table. This provides a more accurate picture of Jenny’s finances by looking at monthly, rather than at one specific month’s, income and expenditure. With these estimates of monthly spending and income recorded, the ‘reality check’ is complete and an assessment can be made about the expenditure and income situation.
With these adjustments to gain a more accurate monthly picture, you can see that Jenny’s expenditure actually exceeds her income by £122 per month. This is very different from her initial cash flow estimate of a £98 surplus.
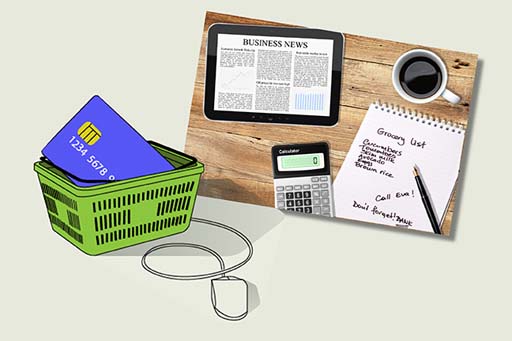
3.2 Setting a budget – things you need to think about
You’ve seen that to determine a budget, both income and expenditure need to be considered. Once these have been established there are two other things that should be reviewed.
First, what does the total amount of spending need to be in relation to your income each month, now and in the future, to enable your financial objectives to be achieved – for instance, paying off your mortgage or paying for your holidays?
Second, should the pattern of expenditure be changed?
Of course, it’s possible to be happy with the total amount of expenditure in relation to income but nevertheless to want to alter how that money is being spent. In other words, you might want to change the pattern of your spending. To illustrate, if someone wants both to do more for charity and to lead a healthier lifestyle, they may decide to give money to their favourite charity while buying fewer music downloads, and to join a gym instead of spending evenings in the pub. These don’t require a change in the total amount of expenditure, just a change in the pattern.
Decisions on changing the pattern of expenditure involve trade-offs: giving more to charity means a trade-off in terms of buying fewer music downloads. Another way to put this is in terms of opportunity costs: the opportunity cost of giving that money to charity is the music downloads that could have been bought. Put like that, it doesn’t sound much of a contest, but trade-offs also apply to more hedonistic options such as going out clubbing versus paying to see your favourite football team. Remember that opportunity costs work both ways: the opportunity cost of drinking in the pub is not being able to join the gym (as well as the direct health risks), and the opportunity cost of buying the music downloads is not being able to give that money to charity.
In Jenny’s case, she’s set herself the goal of reducing, or eventually eliminating, the gap between her income and her expenditure, and the goals of building up an emergency saving fund and paying off her personal loan – all at the same time. There are different approaches she might take to achieve all of this, as you see next.
3.2.1 Jenny’s options (Stage 2: decide on a financial plan)
What are Jenny’s options?
- Do nothing and hope things get better. Things may get better (an unexpected Lotto win?), but they may also get worse (an unexpected car repair bill?). Unexpected bills are a common reason why people go into debt.
- Increase income. This could be done by working overtime or by taking a second job.
- Reduce total spending and change the pattern of expenditure.
Let’s assume that Jenny has rejected the first approach, and that the second is not realistic for her at the moment. This leaves the third option – reducing total expenditure and changing her pattern of expenditure.
Although reducing her total expenditure is all that is necessary to achieve Jenny’s goal of lessening the gap between income and expenditure, in practice this will involve changing her pattern of expenditure too. This is because there are some forms of spending that are difficult to reduce and so others will have to take a more than proportionate cut. It’s also very hard to carry out a plan simply to reduce total expenditure – where and in what way the cuts are to fall has to be decided.

The first step in deciding where to make such cuts involves thinking about what constitutes essential and non-essential expenditure. Spending on food and housing would be defined as essential, but other items are less defined. These comparisons can make the distinction between what is essential and non-essential more difficult.
In the mid to late 1990s only a minority of UK households owned mobile phones and had access to the internet – yet most people now have access to these technologies. Are these essential items? Many people would argue that to participate fully in contemporary society they are. Although not essential for physical survival, not having these items can make someone feel excluded from society. If everyone else is communicating by mobile phone, for example, this creates pressure to own one.
Look at the goods and services you spend money on. Which do you consider to be essential?
How do you decide whether or not something is essential? You’ll have your own answers to this question, but your thinking will probably be affected by your income and social class. The sociologist Pierre Bourdieu pointed out that the size of a person’s income or being in a particular social class may affect the distinction between what is seen as essential and non-essential (Bourdieu, 1977).
Where particular goods or services are seen as essential, expenditure on them can’t be cut out completely. In this instance, budgeting is more about reducing the costs of these and other items, for example, by buying fewer of them, or a cheaper version. Part of this process usually involves careful ‘shopping around’, searching and comparing prices – a process made easier in recent years by the emergence of price comparison sites on the internet.
Now you take a look at some of the social and behavioural factors that influence spending. We’re going to come back to Jenny and how she resolves her budget problems later this week.
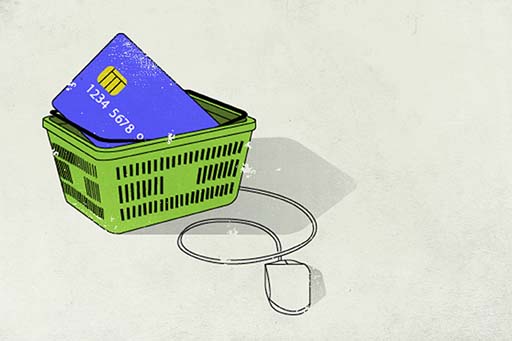
3.2.2 High street shopping in your kitchen
The emergence of online shopping provides the convenience and ability to shop around in a global marketplace, allowing those consumers who have access to the internet the chance to find the best deals. A survey in 2017 found that 87% of UK consumers had bought an item online within the previous 12 months and that the UK was second only to Norway for making e-commerce purchases in Europe (gurufocus.com, 2017).
It can also be argued that the convenience of paying online can lead to spending even more. Consumers can shop around the clock without the need to leave the comfort of their own home and may be more likely to make impulse purchases. Such technological changes in the way we buy goods and services are not new, and the shift from using cash to using cheques, and then from cheques to debit/credit cards had similar effects.
The transformation that the internet is bringing to our shopping habits was vividly demonstrated by the results of the Christmas shopping period in the 2010s. The UK stores that delivered the most impressive results for sales – John Lewis, House of Fraser and Next – all have huge and highly effective internet shopping systems. Additionally those supermarkets that performed strongly over the same period tended to be those that offer a good online shopping capability.
Shopping online does expose us to the risk of being defrauded by rogue sites posing as genuine online retailers, as you will see next.
3.2.3 Spotting dodgy websites
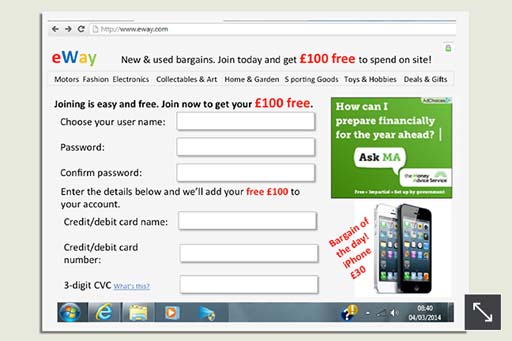
Which features would make you suspicious of this online retailer?
3.2.4 The dodgy website – what did you spot?
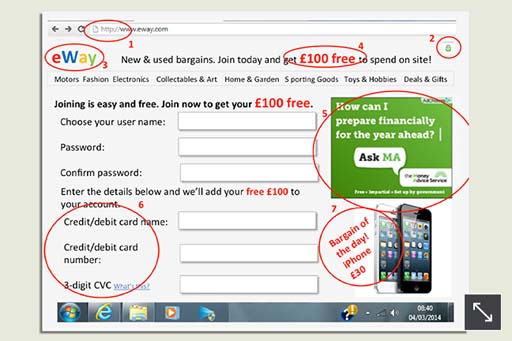
Well, what aroused your suspicions? You may have spotted some, or all, of the following.
- This site is asking for details, like a password, that should be gathered only over a secure site. But the site address (URL) starts with ‘http://’. A secure site’s address will start with ‘https://’.
- Another sign of a secure site is a padlock symbol. It should appear just before the website address or sometimes in the bar at the bottom of your computer screen. If, as here, it appears only in the body of the website, this is an indication that it could be fake.
- A name and logo that are very similar to a real website. It’s designed to trick you into thinking you’re on the real website or an associated company’s site.
- Inducements to sign up right now, so you don’t have time to think carefully about what you’re being asked to do.
- Genuine ads from real organisations designed to reassure you that the site is a trusted one.
- Collecting card or bank details over an unsecure site and unrelated to any purchase. This is the whole purpose of the fraudsters: to steal your card details and then go shopping at your expense.
- If an offer sounds too good to be true, then it usually is.
You might also notice that there are no contact details on the site, so there’s no way to find out more or to complain if things go wrong.
Here are some useful tips for consumers buying online – although many tips on buying online are the same as for buying from a shop.
- Shop around. That great deal might be on offer somewhere else – and cheaper.
- Use retailers and services you know about – or ones that have been personally recommended to you.
- A company might have a great website, but that doesn’t mean it’s law-abiding.
- Make sure you know the trader’s full address – especially if the company is based outside the UK. The internet makes buying from abroad easy so it’s important you know your rights.
- Don’t assume an internet company is based in the UK just because its web address has ‘UK’ in it – check out the physical address and phone number.
- Take into account the shipping, postage and packing costs. Weigh them up against the parking and travelling costs you would have to pay if you went to the high street.
- Although shopping from overseas websites is relatively safe, it may be difficult to enforce your contract if things go wrong. If the item or service is over £100 consider paying by credit card.
- Look for websites that have a secure way of paying (known as an encryption facility) – these show a padlock, as noted above, before the web address or at the bottom of the screen when you’re filling in the payment details.
- Check whether the company has a privacy statement that tells you what it will do with your personal information.
- If buying from an auction site, check the seller’s reputation. Be careful, some traders will make up accounts and post good comments about themselves. Look to see how many transactions the person giving feedback has carried out online; a number next to their name will indicate this.
- Be wary: if the price is too good to be true, it usually is.
3.2.5 Heuristics and spending
One reason why people sometimes pay higher prices for certain goods and services is that they think a higher price equates to higher quality. The price of a product is often used as a mental short cut to assess quality. Such short cuts are called heuristics and they’re used to help assess situations when there’s limited information available.

Transcript
3.2.6 How to trim your expenditure

There are so many ways to save money. Here are a few of the more common ideas from personal finance experts.
- Paying some bills by direct debit may save you money, for example utility bills. (But check this carefully as some bills such as household and car insurance may cost more if paid monthly by direct debit.)
- Think about remortgaging. Saving 1% on a £100,000 mortgage saves up to £83 a month (you look at mortgages in more detail in Week 6).
- Shop around when it’s time to renew insurance premiums. Premiums are often increased each year, relying on customers not bothering to switch to another company. Also check that you’re not paying for any ‘extras’ you didn’t ask for or want (you look at insurance in Week 8).
- If you’re paying high interest on your credit cards, look for 0% deals on balance transfers but check for transfer fees.
- Switch suppliers of gas, electricity, telephone or internet connection. Consider a water meter. There are major savings to be had in these areas.
- Reconsider being a member of a gym, and pay as you go instead – this can save money depending on how often you go.
- Think about whether a branded item is really value for money.
- Cut down on the number of takeaway meals you have – cutting from two to one a week would typically save over £250 a year.
- Call your mobile phone supplier and ask them if there’s a better tariff to suit your needs.
- Buying in bulk for items such as contact lenses saves a lot of money.
- Taking packed lunches to work can save lunch costs.
- Buy fresh fruit and vegetables in season. Check whether a local market is cheaper than the supermarket.
- Turn off lights, don’t leave stand-by buttons on and turn down the thermostat to save large amounts on energy bills (and help the environment) each year.
- Make a shopping list and stick to it. Try to use money-off coupons from papers and magazines where possible.
- Think carefully about buying extended warranties – it may be better simply to put aside some money in case of a problem.
- If you have internet access, look for price comparison websites to find the best deals.
You’ve read the list of tips from experts. Can you identify any social and economic changes that have influenced these ideas?
3.2.7 Consumer society in 2018
It could be argued that many of the money-saving tips you’ve discussed have arisen as a result of social and economic changes in the UK in recent decades. Some, such as being able to shop around for a cheaper internet or phone company, reflect the increased competition in certain sectors of the economy, with more suppliers available in the marketplace. Others, such as thinking about the cost of gym membership or cutting down on takeaways, reflect the increased focus in the media on healthy lifestyles. Technological change is also important with reference to mobile phones, buying online and comparing prices online.
The consumer society and the behavioural factors that drive spending decisions – which you looked at earlier this week when you examined ‘heuristics’ – are relevant when considering the motives behind buying certain branded items. The list of money-saving tips is particularly interesting because it highlights how social and economic changes can both increase household expenditure through more choice and pressure to buy, yet at the same time provide ways in which expenditure can be reduced.

3.3 Jenny’s spending and her goals
In this week, you reach ‘first base’ in managing your money – control over your income versus spending – and linkage of your finances to your life’s ambitions and goals.
When all the options have been weighed up and the necessary adjustments have been made, the final result is a budget showing planned expenditure and income for the following month(s).
In Jenny’s case, after making all of her adjustments to the pattern of her expenditure, her budget might look something like the third column in the table. By listing the budget together with her starting position, it’s easier to see the changes Jenny is planning to make. The new overall difference between income and expenditure is at the bottom of the budget.
| Cash flow (£ per month) | Average month (£ per month) | Budget (£ per month) | ||||
|---|---|---|---|---|---|---|
| NET INCOME | ||||||
| Earnings | Total 1115 | Total 1115 | Total 1115 | |||
| TOTAL NET INCOME | 1115 | 1115 | 1115 | |||
| Rent | 250 | 250 | 250 | |||
| Council Tax | 50 | 50 | 50 | |||
| Regular bills (gas, electricity, water, etc.) | 30 | 60 | 50 | |||
| Telephone (mobile and landline) | 40 | 40 | 30 | |||
| Home insurance (contents and building) | 12 | 12 | 10 | |||
| Household goods | 15 | 30 | 30 | |||
| Food and non-alcoholic drinks | 150 | 150 | 120 | |||
| Alcohol | 40 | 40 | 40 | |||
| Tobacco | 30 | 30 | 0 | |||
| Clothing and footwear | 50 | 50 | 40 | |||
| Medicines, toiletries, hairdressing (personal) | 30 | 30 | 30 | |||
| Going out | 120 | 120 | 80 | |||
| Holidays/other leisure | 20 | 100 | 50 | |||
| Motoring costs (insurance, petrol) | 70 | 130 | 180 | |||
| Birthday presents/charity/other gifts | ||||||
| Christmas presents/gifts | 10 | 45 | 30 | |||
| Personal loan repayments | 100 | 100 | 100 | |||
| TOTAL EXPENDITURE | Total 1017 | Total 1237 | Total 1090 | |||
| SURPLUS/DEFICIT | 98 | -122 | 25 | |||
Compare Jenny’s budget (shown in the budget column) with her previous pattern of spending (shown in the average month column) in the table. What things is she spending more on, and what is she spending less on? Do you think this budget will help her to meet her goals?
The impact of Jenny’s decisions can be seen in the graph, showing her moving from a deficit to a surplus on her budget, which she intends to maintain in the future.
3.3.1 Jenny adjusts her budget (Stage 3: acting on the financial plan)

Transcript
The only item of expenditure that has increased is Jenny’s payments on motoring costs. If Jenny sticks to her budget, she can save £25 a month and increase her motoring cost payments to £180 per month. If Jenny’s budget is implemented as planned, her income and expenditure profile will look much healthier in financial terms.
In the graph that you’ve just seen, for example, from 2018 Jenny’s income increases and her expenditure falls, and her income exceeds her expenditure. She is no longer adding to her debt (even though it may take her some time to pay off her existing debt), and she now has some surplus income, shown by the shaded area from 2018. Jenny could use this surplus to pay off some more of her debt and/or use it for saving.
3.3.2 Budgeting – taking control
The best of intentions and plans can be difficult to implement. One method suggested by personal finance experts to help implement a budget is an ‘envelope system’. This system uses hypothetical or, perhaps, real envelopes for each type of expenditure, and allocates the amount of money planned for that type of expenditure to its envelope. An alternative could involve using (empty) jam jars. Another way is to set up separate savings accounts for certain – more major – items of expenditure like holidays or a new car.
Once the different directions of spending and their ‘envelopes’ have been worked out, money is allocated to each of them and the ‘envelopes’ filled, by putting that money into different accounts. For example, the bank current account may be allocated an amount each month to pay for food and regular living expenses, such as travel costs, and commitments, such as insurance premiums.
A savings account may be allocated money for infrequent expenditure, so that money is built up to pay for holidays, birthdays or Christmas, while another savings account may be used for saving in case of an unexpected crisis. A fixed amount of cash each week is also needed for those areas usually paid for in cash, such as entertainment.
The idea of the envelope system is that you do not then switch money between these areas – when the envelopes run out, they run out. This creates a strong discipline to keep to the allocated budget amount.

3.3.3 Ways of saving
What’s your method of setting aside amounts of money? Watch this video and see how members of the public set aside their money.

Transcript
3.3.4 Budgeting (Stage 4: reviewing the financial plan)
As budgeting is an ongoing process a review date is usually fixed. Initially, this review may be in just one month’s time, since at the beginning there may be some trial and error in the budgeting process. After a while it should settle down, and the review dates can be extended to, say, every six months.
At the review date a new cash flow statement needs to be calculated, with all the necessary information entered, to see whether the budget is working. The new cash flow statement allows the plans of the budget to be compared with what actually happened. It’s probable that more amendments may be needed as it becomes clear how easy or difficult the budget was to implement. A new budget is also required if the goals for which the budget was designed change. A further reason for review would be if income changes, and a new budget with more adjustments in expenditure is then required.
External influences, such as price rises and interest rate changes, are also likely to impact on budget plans. For example, a 5% annual inflation rate applied to Jenny’s expenditure would increase it from an annual figure of £13,080 (12 × £1090) to £13,734 – an increase of £654. Jenny’s income may have risen to accommodate this increase, but incomes may not always change at the same rate as prices so monitoring and reviewing these changes is important.
It’s easy to see how such external changes can greatly impact on financial plans, given that after her budgeting exercise Jenny was planning to save only £300 p.a. (£25 × 12 months). This is one reason why financial experts suggest adding a little on to planned expenditure to allow for price increases. For instance, a look at previous gas and electricity bills can show how much energy prices have risen. This precautionary approach may help to avoid some unpleasant surprises.
3.3.5 Now complete your budget
You’ve got to the point where you should be able to complete your budget. Have a go at doing this now, using the MAS budget planner that you worked with first in Week 2 (remember to open it in a new window or tab). You’ve now got figures for both your income and expenditure, and so you can complete your budget in your fact find. You might want to revise your budget by making use of the third column – unless of course you’re entirely happy with your budgetary state of affairs.
What does the completed budget tell you about your current financial position?
What actions – if any – are you going to take to improve your financial position? Will this involve trying to increase income or cut expenditure or both?
Week 3 quiz
This quiz allows you to test and apply your knowledge of the material in Week 3.
Complete the Week 3 quiz now.
Open the quiz in a new window or tab then come back here when you're done.
Week 3 round-up
In Week 3 you’ve seen how comparing your expenditure with your income enables you to draw up a budget.
Effective budgeting provides the means for individuals and households to identify their priorities and objectives, and helps to identify what has to be done to achieve them.
Well done! You’ve completed your study of how to manage household cash flows.
Next you start to explore the various assets and liabilities people also have to manage during their life course. Week 4 looks at debt and borrowing – a subject familiar to virtually all households in the UK.
You can now go to Week 4: Debt and borrowing
References
Acknowledgements
This unit was written by Martin Upton and Jonquil Lowe.
Except for third party materials and otherwise stated in the acknowledgements section, this content is made available under a Creative Commons Attribution-NonCommercial-ShareAlike 4.0 Licence.
The material acknowledged below is Proprietary and used under licence (not subject to Creative Commons Licence). Grateful acknowledgement is made to the following sources for permission to reproduce material in this unit:
Unit image
Figures
Figure 7 © The Open University/iStockphoto.com/pressureUA/hh5800/blueclue/rustemgurler
Figure 12 © iStockphoto.com/tirc83
AV
Ways of saving © Money Advice Service
Every effort has been made to contact copyright owners. If any have been inadvertently overlooked, the publishers will be pleased to make the necessary arrangements at the first opportunity.
You can now go to Week 4: Debt and borrowing
Don't miss out:
1. Join over 200,000 students, currently studying with The Open University – http://www.open.ac.uk/ choose/ ou/ open-content
2. Enjoyed this? Find out more about this topic or browse all our free course materials on OpenLearn – http://www.open.edu/ openlearn/
3. Outside the UK? We have students in over a hundred countries studying online qualifications – http://www.openuniversity.edu/ – including an MBA at our triple accredited Business School.