Week 5: Savings and investments
Use 'Print preview' to check the number of pages and printer settings.
Print functionality varies between browsers.
Printable page generated Sunday, 19 May 2024, 10:11 AM
Week 5: Savings and investments
Introduction
Why do people save? Link savings to events in the life course. Understand savings rates and savings products. The choice between fixed and variable rate savings. See how the internet has changed the savings market.
This week you explore the many different ways of saving and investing. Martin explains the differences between the products, including the returns they provide, and the risks you take on when investing in them. You also have the chance to link to a savings calculator to see how your savings grow in different scenarios.

Transcript
This course is presented with the kind support of True Potential LLP.
The True Potential Centre for the Public Understanding of Finance (True Potential PUFin) is a pioneering Centre of Excellence for research in the development of personal financial capabilities. The establishment and activities of True Potential PUFin have been made possible thanks to the generous support of True Potential LLP, which has committed to a five-year programme of financial support for the Centre totalling £1.4 million.
5.1 Managing savings and investments
This video was produced by the government’s savings agency National Savings & Investments (NS&I). It starts your analysis of savings by looking at their linkage to financial planning, and it resonates with the course’s key theme of ensuring that in all financial matters a rigorous planning process should be applied.

Transcript
5.1.1 Why should households save?
Saving defers consumption from the present to a time in the future. Therefore, when thinking about the reasons for households to save, we’re really thinking about why households are deferring consumption rather than consuming now.
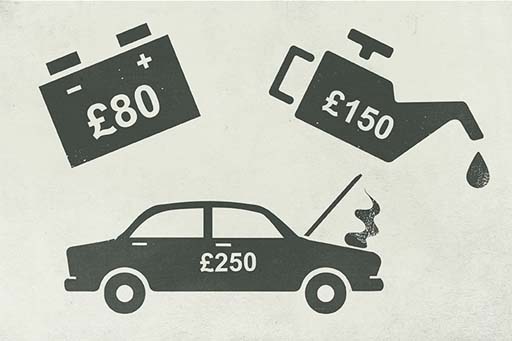
One important reason for saving is known as the ‘precautionary motive’ – perhaps more commonly known as ‘saving for a rainy day’. This involves building up savings to provide for unexpected events and bills. If you have no savings and an unexpected event with financial consequences occurs (such as a car being damaged or someone becoming too ill to work and losing their income), then there are only three alternatives:
- receiving a pay-out from any insurance taken out against such an unexpected event
- borrowing money (from family, friends or financial institutions) to pay the unexpected bills
- defaulting on any commitments, for example not making payments on a car loan or a mortgage, with the consequent risk of repossession and negative impact on future credit ratings.
Having savings is an important means of preparing for unexpected life events – the savings act as a buffer to protect a household against these other possibilities.
A second reason for saving is to do so for a specific purpose. You can put a certain amount aside each month (or week), based on a calculation of how much you need for a particular goal. One of the most significant purposes for saving is for retirement, but saving can also be for many other reasons, for instance saving for a child’s university education, sending money abroad to family or paying the costs of a nursing home for a parent. You can also save for events that occur in the relatively near future, like a holiday or Christmas, or for buying a car.
A third reason for saving could be to accumulate wealth for which, as yet, there is no defined purpose. The savings may later be spent on a variety of things, for example a second home, cosmetic surgery, a series of holidays after retirement or leaving an inheritance to children.
These three reasons all underline an important overall aim of having savings – to give a sense of independence and autonomy to do things. Having sufficient savings could enable you to leave a job or to take a break for a few months. Or it could enable you to do or buy things that you want, or to take advantage of opportunities that arise.
5.1.2 Savings and the life course
In the table are the various stages of the life course and the motives for savings. Take a look at these points in the life course and then at the motives for saving.
| Life course stage | Motives for saving |
|---|---|
| Young, single | Car, house |
| Young couple, no children | House |
| Couple with dependent children | Saving for children's future, retirement |
| Single with dependent children | Saving for children's future, retirement |
| Older couple with nearly independent children | Savings for childrens future, retirement |
| Older, single, no children | Retirement |
| Older couple with independent children | Retirement |
| Couple, retired | Use savings for income, bequests |
| Single, retired | Use savings for income, bequests |
Households are often targeted by the marketing departments of financial institutions according to their stage in the life course and their type of household. These are significant factors in the selling of different types of saving and investment products.
What are your reasons for saving money?

5.1.3 Life’s events and savings
Whatever the motive to save, life events at any age can have an impact on saving plans – sometimes leading to starting or undertaking more saving, but at other times leading to less saving or ceasing to save altogether.
It is highly likely that you have experienced, or will in your lifetime experience, one of the events listed in the table, and so it is important to think about some of their consequences.
| Percentage of non-savers starting to save after the event | Percentage of savers ceasing to save after the event | |
|---|---|---|
| Divorce/seperation | 15 | 46 |
| Marriage | 25 | 29 |
| Having a first child | 23 | 41 |
| Having a seconf or subsequent child | 14 | 38 |
| Becoming unemployed | 8 | 71 |
| Moving into employment from unemployment | 29 | 38 |
| Moving house | 20 | 40 |
| Becoming a carer for at least 20 hours per week | 18 | 33 |
According to the data, unemployment has the greatest impact on saving – 71% of savers who experience unemployment stop saving. Moving back to employment has the biggest impact in causing non-savers to start to save, with 29% starting to save. Unemployment and employment have a large direct impact on an individual’s or household’s income and therefore on their ability to save.
The figures for divorce or separation, marriage and having children are also interesting. Joining together to form a household brings economies of scale, and so gives more scope for saving in a household budget. The high figure for non-savers starting to save after marriage isn’t too surprising, therefore. Similarly, divorce or separation may lose such economies of scale, making saving harder. So, again, it is perhaps not surprising to see that 46% of savers cease to do so after divorce or separation.
5.2 Understanding savings products
Here you start to explore the different savings choices for a household that has surplus income or has budgeted to create surplus income. You begin to learn to make some important distinctions between savings products:
- products that earn interest where the nominal value of the capital (the amount you put into the product) stays the same
- investment products, which you look at later, that can make capital gains and capital losses, where the investment you make can subsequently go up and down in value.
There are thousands of different savings products available, and such choice can be daunting. Yet it’s possible to make sense of the choice with reference to available interest rates and the taxation of that interest. An understanding of these, as well as a clear idea about the reason for wanting to save, should provide enough background information to make a more informed decision about a product.
The financial services industry is required to show interest rates on all savings products so that they can be easily compared. You saw last week how interest rates on debt products are expressed as the Annual Percentage Rate (APR). For savings products the comparable rate is called the Annual Equivalent Rate (AER).
The AER and the APR are similar in principle, and allow a comparison of financial products with different payment patterns. The AER is the annual interest rate that savers receive, taking into account when interest is actually paid (for instance, annually, quarterly or monthly).
Week 4 also introduced the idea of real interest rates – thinking in real terms can help to show what’s happening to the value of savings over time. For example, the significance of a 5% interest rate on savings is dependent on the rate of inflation, and is very different at either 1% or 6%.
In the latter case, the real interest rate is actually negative, that is, your savings could buy less in a year’s time, even after the receipt of interest. Theoretically, this could cause some people to decide to consume more now and save less. Conversely, when inflation has been high in the UK, it can make people want to save more to make sure the real value of their savings is not reduced.
In the UK, only National Savings & Investments periodically offers an inflation-proofed savings product in the form of index-linked certificates. For example, holders of the 48th issue five-year certificates are guaranteed to get their original investment (their ‘capital’) back at the end of five years with interest equal to inflation over the period plus 0.5% a year, in other words a real return of 0.5%. Someone who invested £1000 in these five-year index-linked certificates on the first date of their issue in May 2011 would, on 6 April 2016, have found that they had a valuation of £1172.80, giving a nominal return since the start of the investment of 3.3% a year once inflation had been added to the real return.
At times of low inflation, the return on index-linked investments can seem unattractive, but they come into their own in periods when inflation is expected to be high. Most savings products do not offer inflation-proofed returns.
If you want to explore savings accounts further and the returns you receive on them why not access the MAS savings calculator?

5.2.1 Variable rate and fixed rate savings products
In this audio a young professional, Ryan, ask for help from personal finance expert Jonquil Lowe in finding his way through the many savings products on offer.
We join their conversation as Ryan asks about a savings product he’s come across called a ‘term bond’.
Transcript
The other savings options that are described are trackers, variable rate accounts and notice accounts.
5.2.2 Spot the highest Annual Equivalent Rate (AER)
This quiz tests your ability to spot the highest Annual Equivalent Rate (AER).
Activity 1
a.
Daily
b.
Weekly
c.
Monthly
d.
Yearly
The correct answer is a.
a.
Well done. Daily is the correct answer. The more frequent the payment, the more compounding of interest there will be. Therefore, annual 5% interest paid weekly will have a higher AER than 5% paid monthly, which in turn will have a higher AER than 5% paid quarterly. The table here shows AERs for each period.
Answer
| Advertised rate | 5% | |
|---|---|---|
| Period rate | AER | |
| Daily | 0.0137% | 5.127% |
| Weekly | 0.0962% | 5.125% |
| Monthly | 0.4167% | 5.116% |
| Quaterly | 1.2500% | 5.095% |
| Annually | 5.0000% | 5.0000% |
5.2.3 Savings accounts on offer

In the mid-2000s, there were major developments in ‘e-banking’ or online banking. Online savings (or ‘e-savings’) accounts can usually only be accessed online. With many accounts, the saver transfers money when needed from their online savings account into their current account electronically, which they can then access as they usually would. Some online accounts have a cash card, so money can be withdrawn via cash machines.
Interest rates are often (but not always) higher for ‘e-savings’ accounts because savers themselves manage the account. This reduces the costs to the bank or building society in terms of issuing a passbook or requiring branch availability to make transactions, however some institutions, although not all, require a current account to be held with them as well as the online savings account.
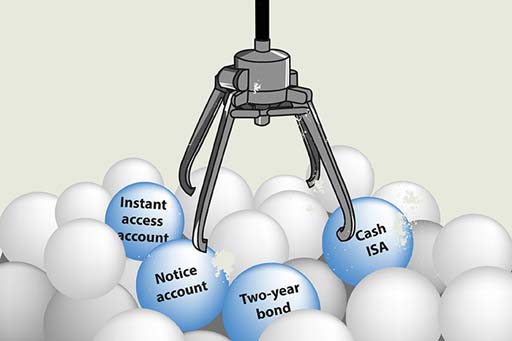
Every high street has multiple offers of different types of savings account from banks and building societies. Take a look at some of these in the table below, and then join in the discussion, focusing especially on these two points:
- What do you think are the key factors that explain why some accounts offer higher rates than others?
- Why would anyone want to take out an ‘Instant Access’ account?
| Name of account | Interest tier | AER (gross p.a.) % |
|---|---|---|
Internet Savings An instant access online savings account | £1+ | 1.25% |
Instant Access An instant access telephone savings account | £1000+ | 1.35%* |
Notice Account A 120-day notice account | £500+ | 1.60% |
5-Year Fixed Rate Bond (interest paid annually) | £1000+ | 2.91% |
Instant Access Cash ISA A tax-free instant access account with cash card | £1+ | 1.41% |
Footnotes
*Includes bonus in first year of 0.85% gross (0.68% net of tax at basic rate of 20%)Footnotes
Savings products – some choices (adapted from Moneysupermarket.com, 2015)5.2.4 Why savings rates differ
In the table you’ve just looked at, the five-year Fixed Rate Bond and the Notice Account both have higher net rates than the Instant Access account. The amount saved also influences the rates offered for both Instant Access and Notice accounts: the higher the savings deposited, the higher the rate.
The Internet Savings account can offer higher rates due to the lower costs of managing the account. Despite this, some people will still choose the most basic Instant Access account, mainly because it provides plenty of flexibility, with instant access using a cash card, so that money can be accessed night or day. The downside is the lower interest rate on offers.
The ISA (Individual Savings Account) is not subject to tax so all savers get the full (or gross) amount of interest. To encourage saving, the annual limit for investments in ISAs is £20,000 per person in 2018/19.
In the March 2016 budget statement it was announced that a new ‘Lifetime ISA’ would be available from April 2017 for those aged under 40 years. These new ISAs will allow tax-free savings of up to £4,000 per annum with the government topping up balances by £1 for every £4 saved. Lifetime ISAs, which can be built up until the age of 50 years, are intended to help people save for property purchase or to help provide income in retirement. To support this development the overall ISA limit (for both ordinary and lifetime ISAs combined) was raised to £20,000 from the 2017/18 tax year.
A new savings scheme for those on low incomes was also unveiled in March 2016 with those on in-work benefits who save £50 per month for up to 4 years getting a 50% (up to a maximum of £1200) top up from the government.
5.2.5 Savings accounts – the risks
In this video Simon Katte of the government’s Money Advice Service (MAS) talks about the risks arising from savings and investments.

Transcript
5.3 Understanding investments
In this section, you will examine how savings and investments differ, understand share investments and the returns they offer and discover why some shares are riskier investments than others.
In personal finance, the terms ‘savings’ and ‘investments’ have different meanings. Savings accounts refer to any form of deposit account that pays interest on top of the amount deposited. The amount deposited is not at risk unless the institution defaults. Investments also allow interest or dividends to be paid but, crucially, the investment itself can fall or rise in value. Financial investments are those products with the warning in the small print that the value of your investment can go down as well as up.
Financial investments, which for simplicity we will call ‘investments’, include shares and bonds and investment funds that hold these types of asset. The amount invested – the ‘principal’ or ‘capital’ – is usually at risk, as well as the rate of return on the investment.
This means that it is not income alone that is relevant (as the rate of interest is on savings products) but the total return, which may be made up partly of income and partly of the change in the value of the capital. If the price of the investment goes up, a capital gain will be made, but if the price goes down, a capital loss is made. Newspapers often print cases of investors who have lost money on investment schemes.
With increased regulation of financial intermediaries and other financial firms, including the actual providers of savings and investment products and their company salespeople, and the requirement to explain fully the characteristics of the financial products they sell, mis-selling of financial products should, in theory, be unlikely, but it still happens.
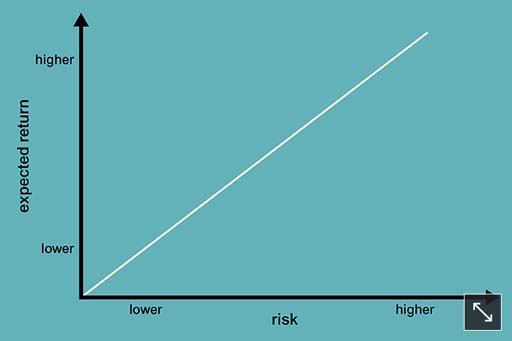
Not everyone reads the small print on documents, or understands all the choices and all the products’ details, but the saying ‘the safest way to double your money is to fold it in half ’ is perhaps a reminder that promises of high returns usually carry higher risks. This can be linked to a risk–return spectrum. Products with low risks tend to have lower returns, and those with higher risks have potentially higher returns, as you see in the graph.
For the rest of this section, you explore investment funds, which represent the usual way that personal investors invest in the stock markets. You may think that investments are not relevant to you, but if you have pension savings or save regularly through a life insurance policy, then whether you know it or not, you are an investor! To understand the nature of these funds, you take a quick look first at how shares and bonds work, since these are the fundamental building blocks of most funds and many other investments.
Before you move on, bear in mind that the definition of the difference between savings and investment being used in this course is not a universal one. In particular, some products that are advertised as being ‘long-term savings products’ may well involve shares or other forms of investment, and so their value can go down as well as up.
5.3.1 Shares
Shares are sometimes called ‘equities’. They entitle the holder to a share or part ownership in a company. Depending on the type of share, this may entitle the shareholder to vote on how the company is run. Shares also usually entitle their owners to receive dividends, paid by the company out of the profit it makes. The receipt of these dividends is, for the shareholder, the income element of the return from their investment in the shares.
Look at the table showing some UK companies’ share prices. Take time to familiarise yourself with the key terms that are used when analysing the performance of a company’s shares.
| High | Low | Company | Price (p) | +/- | Yield | P/E |
|---|---|---|---|---|---|---|
| 456 | 303 | JD Sports | 329 | -4 | 0.4 | 17.9 |
| 395 | 298 | Marks and Spencer | 300 | +2 | 6.2 | 22.3 |
| 253 | 207 | Morrisons (W) | 212 | Unch | 2.5 | 14.0 |
| 5320 | 3617 | Next | 4275 | -31 | 3.7 | 10.0 |
| 218 | 167 | Tesco | 193 | Unch | -- | 34.4 |
Footnotes
Unch = unchangedFootnotes
Where no dividend is paid, there is no measure for yieldHere’s an explanation of the information presented in the columns of the table.
- High: the highest price of share in a certain time period, for example over the last year.
- Low: the lowest price of share in a certain time period, for example over the last year.
- Company: the name of the company whose shares are shown in the table.
- Price: the current price of share, shown in pence.
- +/-: change in share price from the previous day.
- Yield: the dividend income per share expressed as a percentage of the price of the share. High figures can suggest higher income from investments, but a high yield can also indicate that the company is not growing very fast or is quite risky.
- P/E: the ‘price/earnings ratio’ is the share price divided by the earnings per share. So, if the share price is 200 pence and the earnings per share are 5 pence the P/E ratio would be 40. Investors are prepared to pay more for shares whose earnings they think are going to rise strongly, so demand pushes up the share price, which in turn increases the P/E ratio. The P/E ratio is often seen as a barometer of confidence in a company’s prospects.
The price at which a particular share can be bought or sold will vary from minute to minute depending on the balance of investors who want to buy them and existing holders who want to sell. If investors are able to sell shares at a higher price than they originally paid, they make a capital gain. If they sell for less, they make a capital loss.
Shares are bought through a broker. A broker can be found in high-street banks, on the internet or in a stockbroking firm. For online broking, there is typically a flat-rate charge for any transaction, say £12 for one-off trades, or £10 per trade for frequent traders, so it is not usually worth buying or selling shares in very small amounts. Conventional stockbrokers may also charge a percentage commission on the value of the transaction as well as a minimum commission.
Stamp Duty Reserve Tax (SDRT) of 0.5% is paid when shares are bought electronically (which the vast majority are these days). SDRT is not paid when shares are sold. Share prices can be seen in most newspapers that report daily on share prices as well as on other information.
5.3.2 Share prices do go up and down
You’ve probably heard many times the adage that shares can go up and down in value. Sometimes these movements are very sharp and sudden – particularly when shares fall in price. Over the years there have been times when share prices have plummeted. You may have heard of the Wall Street Crash in 1929 when the US stock market plummeted. The pop group 10cc had a hit song, ‘The Wall Street Shuffle’, about the vagaries of share prices in the 1970s.
Shares also collapsed in value worldwide in October 1987, and the video includes footage on what quickly became known as Black Monday. Share prices also fell around the world during and after the 2007 financial crisis.

Transcript
More recently, shares have staged a recovery as the world economy has started to recover from the financial crisis. The second part of the video provides covers this rise in share prices in 2013.
This recovery gathered further pace in 2017 with many stock market indices around the world – including the UK’s FTSE-100 – hitting all-time highs. Are we, though, close to the point where another of those sharp drops in share prices occurs?
5.3.3 Are some shares riskier than others?
Earlier, you looked at the prices of some selected UK companies’ share prices. The details included the price highs and lows of each of the shares over the past year.
Some share prices are more volatile than others. Why do you think this is?
To consider this issue you might want to think about different types of company – utilities, supermarkets, IT companies, construction companies. How might the activities of these different companies become reflected in the volatility of their share prices?

5.3.4 Share price volatility
All shares do move up and down in prices – with these movements often reflecting the general swings in stock market indices. But for some shares these movements are less extreme than for others.
The reason for this is that some companies are expected to make profits each year and for these profits to be relatively stable. This may be because they produce things people always need to buy – for example utility companies or supermarkets. Additionally their size may make it difficult for new entrants to enter their arena of business and reduce their sales and profits. So the prices of the shares in these types of companies are less volatile as investors have greater certainty about their financial performance. Their shares can still fall in price but such falls will tend to be lower than average for the share market as a whole.
By contrast companies whose sales and profits are prone to material change from year to year will have more volatile share prices. Investors know less about what to expect and the announcement of good or bad financial performances can therefore have quite dramatic effects – in both directions – on the companies’ share prices. Companies whose market share can be eroded – perhaps quickly – by new entrants or changes to technology, like biotechnology companies, are particularly likely to have share prices that are more volatile than for the share market as a whole. Mining is another sector where share prices are volatile, with the profits of companies in this sector exposed to changes in world commodity prices.
So we ask the question again: are you a risk taker or risk averse? If the former you might be inclined to dabble in mining shares if the latter you would stick to utilities and sleep easier.

5.3.5 Bonds (fixed interest investments)
A bond generally represents a promise to pay a regular rate of interest over a fixed period, from one to 50 years, plus the promise to repay the nominal value (also known as the face value) of the bond (say, £100) on the maturity date. The interest rate is normally fixed, for instance, at 5% or 10% of the nominal value each year.
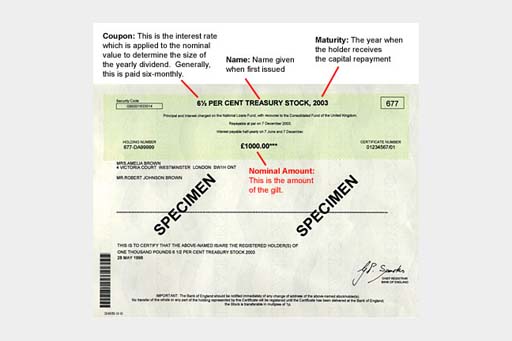
The nominal value is the amount on which the interest is calculated and can be divided into small amounts for sale, usually £1000 or less. For example, an investor could buy £100 nominal of a ‘five-year 5% bond’. This will pay 5% a year for five years on £100 nominal – that is, £5 a year. The interest may be paid quarterly, semi-annually or annually, depending on the type of bond bought. At the end of the five-year period, an investor would receive £100 in repayment of nominal (or ‘face’) value.
Bonds tend to be less risky than shares because they have a promised interest rate and because company bonds rank in front of company shares in the event of a company being liquidated. Although less risky than shares, bonds are riskier than savings accounts. This is because with savings products typically the amount of capital you receive back is fixed – if you deposit £100, you get £100 back.
With a bond, the amount paid back on maturity is also fixed (but may be more or less than the amount paid for the bond). However, if the bond is sold before maturity, then more or less than the promised nominal amount may be paid. Whether it is more or less will depend on movements in the level of interest rates after the bond has been issued. If interest rates fall, the market value of an earlier issued fixed rate bond will rise since it offers investors an interest rate higher than that currently being offered on newly issued bonds. The reverse applies if interest rates rise.
An additional risk of bonds is if the issuer of a bond defaults. UK government bonds, known as gilts, are seen as safer than bank and building society accounts, as the government is even less likely than a bank or building society to default. Bonds can be bought through stockbrokers or, in the case of gilts, through a special Purchase and Sale Service organised by the Debt Management Office, the government department responsible for issuing government debt.
One problem with bonds is that not everyone means the same thing when they talk of a ‘bond’. The kinds of bond we have described are company or government bonds with a fixed interest rate and a fixed repayment date. But the term ‘bond’ has sometimes been taken in vain. Financial intermediaries have sold bonds that were in effect shares by another name. Similarly, long-term savings products may not only be bank accounts promising interest, but also linked to company bonds or shares. There is no regulation in the UK on terminology, and consequently it is important to read the small print of any product.
Some National Savings & Investment products use the name ‘bond’ – for example, Premium Bonds and Income Bonds – but are types of deposit. A range of products, some that are deposits and others more risky investments, used to be called Guaranteed Equity Bonds. Although they have since been reclassified as ‘structured products’, they still individually go by names such as Capital Bond, Stockmarket Linked Bond and Double Asset Bond. Therefore, in reality, the term ‘bond’ is applied to products that are very different, and not just company or government bonds. To get round this confusion, you will also see true bonds referred to as ‘fixed interest’ investments – as noted earlier.
An important product that does not fit within the bonds category that we have described is the Premium Bond. Premium Bonds, owned by 22 million investors in the UK in 2016, are a lottery-based form of savings account backed by the UK government. A lottery is held every month and the equivalent of 1.3% p.a. (in 2016) on all the Premium Bonds is paid out in tax-free prizes.
5.3.6 Investment funds
Buying shares in a single company or even holding shares in, say, three companies, is generally a risky form of investment. This is because the fortunes of a company, on which its dividends and share price depend, are subject to all sorts of risk. These risks can be broad economic risks, such as recession or an increase in the cost of oil, or risks specific to each company, such as the loss of a major contract or increased competition.
To spread these risks, investors typically invest in shares – and other assets, such as bonds – through investment funds. An investment fund pools the money of lots of investors and uses it to hold a wide range of shares, bonds and other assets. Even relatively small amounts of money placed into such funds can be spread across a wide variety of shares or other assets.
With different compositions of investments the returns from different unit trusts vary substantially.
| 1 | BlackRock Gold and General | 684% |
| 2 | JPMorgan Natural Resources | 579% |
| 3 | Threadneedle Latin America | 360% |
| 4 | Scottish Widows Latin America | 343% |
| 5 | Jupiter Financial Opportunities | 336% |
| 767 | Inv Perp Japanese Smaller Companies | -66% |
| 768 | Legg Mason Japan Equity | -68% |
| 769 | JPMorgan Japan | -69% |
| 770 | New Star Technology | -70% |
| 771 | AXA Framlington Global Technology | -72% |
Footnotes
NOTE: past performance is no guarantee of future performanceThe investments in these investment funds may be selected by managers, based on their research, which aims to assess the prospects for shares and other bonds (called ‘actively managed’ funds). Investors pay fees for the services of the fund managers and are provided with periodic reports on their investments. Other funds (called ‘passively managed’ or ‘tracker’ funds) simply hold investments designed to move in line with a specified share index, and typically have lower charges.
Investment funds come in many forms, including:
- Unit trusts: this is an arrangement whereby trustees hold shares and/or other assets on behalf of investors and a management company makes decisions about what and when to buy and sell. Investors hold units in the unit trust and the value of the units directly reflects the value of the underlying assets in the fund.
- Open-ended investment companies (OEICs): this is very similar to a unit trust, but is structured as a company rather than a trust. This structure is more familiar and acceptable to investors in other countries of the European Union and so enables managers to trade more easily across borders. Investors buy shares in the OEIC and the value of the shares directly reflects the value of the assets in the underlying fund.
- Investment trusts: these are companies that are quoted and traded on the stock market. But, unlike trading companies, the purpose of an investment trust company is to run an investment fund. Investors buy shares in the company. The price of the shares partly reflects both the value of the assets in the underlying fund (called the ‘net asset value’ or NAV). But the price is also affected by the balance between investors buying and selling the shares on the stock market. As a result, the shares could trade at less than the NAV (called trading at a discount) or at more than the NAV (trading at a premium). Like any other company, investment trusts can borrow money, which enables them to boost the amount they can invest. Borrowing to invest increases the inherent risk of the fund.
- Exchange-traded funds (ETFs): these are also companies traded on the stock market but, in this case, the share price is directly linked to the value of the underlying investments. Traditionally, ETFs are tracker funds. This could be, for example, the FTSE 100 Index or a more unusual index tracking, say, the price of commodities or works of art. But, increasingly, new types of ETF are being developed that follow different investment strategies.
- Life insurance funds: some types of life insurance can be used as investments. The investor pays in regular premiums or a single lump sum premium and the policy builds up a cash value that may be drawn out either as a lump sum or as a stream of income payments, depending on the particular type of policy. Often policies are unit-linked, which means that the premiums are invested in the policyholder’s choice of one or more funds, similar to unit trusts. The cash-in value of the policy depends on the performance of these funds.
- Pension funds: in a similar way to life insurance, contributions to a pension scheme may be invested in one or more underlying funds. The value of the pension scheme depends on the performance of those funds. You will look at pension schemes in detail in Week 7.
Investment funds can be bought direct from fund managers, through stockbrokers or through websites (often called ‘platforms’).
An additional consideration for many people is a desire to invest their money in a socially responsible way. There are different aspects to what constitutes socially responsible investment, including both positive and negative criteria.
Positive criteria include investing in companies that treat workers fairly or are engaged in environmental protection. Examples of negative criteria include avoiding funds that invest in companies involved with animal experiments, arms, violating human rights or pornography.
One difficulty for an investor is that ethical or social responsibility is a relatively subjective term so you need to examine where the fund invests your money. One way of checking whether a fund that claims to be ethical or socially responsible shares your own views, is to check the main companies the fund invests in.
5.4 What are the best performing investments over the long term?
Now that you’ve had a look at the alternative forms of investment , which of shares (equities), gilts (government bonds) or savings accounts (cash deposits) do you think provides the best returns to investors over the long term?
5.4.1 What is the best long-term investment?
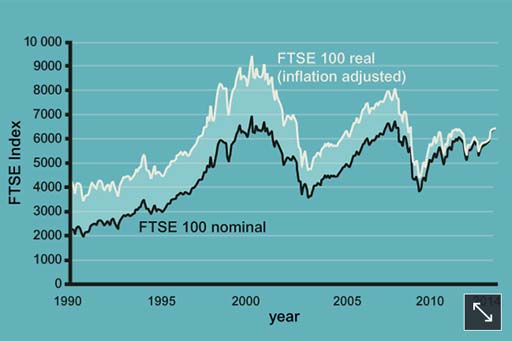
We know from the oscillations of equity markets that capital invested in shares is at high risk of losing value – although, as you see in the data presented in these tables, over long periods of time the performance of shares (equities) normally outperforms that of bonds (gilts) and cash deposits (savings accounts).
The uncertainties related to investments in equities – the reality that the prices of shares do move up and down – is highlighted by the chart that you saw in the previous discussion, which shows the movement in the FTSE 100 (the index based on the share prices of the 100 largest companies listed on the Stock Exchange) between 1990 and 2017.
The three tables here show the findings of a detailed study by Barclays into the differential performance of investments over the medium to long term. The findings are clear: the markets in shares (equities) may be volatile at times but over the long term the historical evidence is that they outperform other forms of savings and investments.
| 1899—2015 | 2005—2015 | |
|---|---|---|
| UK equities | 5.0% | 2.3% |
| Gilts | 1.3% | 3.0% |
| Savings accounts | 0.8% | -1.1% |
Footnotes
‘Real’ return is the return after adjusting for inflation| Time period assets held | ||
|---|---|---|
| 5 years | 10 years | |
| Percentage of times equities outperformed gilts | 72% | 79% |
| Percentage of times equities outperformed savings accounts | 75% | 91% |
Footnotes
Equity outperformance of gilts (government bonds) and savings accounts in defined time periods, 1899–2015| Nominal | Real | |
|---|---|---|
| UK equities | £2,265,437 | £28,232 |
| Gilts | £36,395 | £454 |
| Savings accounts | £20,535 | £256 |
Footnotes
'nominal' means before adjusting for price inflation; 'real' is the return after adjusting for price inflationFootnotes
Value at the end of 2015 of £100 invested at the end of 1899, with gross income reinvested5.4.2 How investments are taxed
Start by looking at the table to see the details of the allowance and tax bands for different forms of investment in 2018/19.
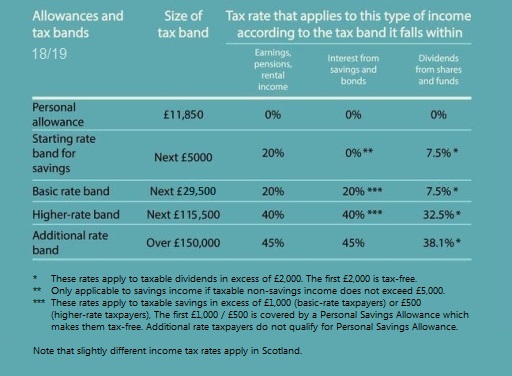
The taxation of interest from bonds, also known as fixed interest investments (and unit trusts and OEICs that invest mainly in bonds) is very straightforward because it is taxed in the same way as interest from a savings account. However, unlike savings accounts, interest from most bonds is paid out gross (without any tax already deducted).
Gains from investments are subject to Capital Gains Tax, but every person has a yearly tax-free allowance (£11,700 in 2018/19). Only gains in excess of that amount are taxable and, in 2018/19, the rate which then applies is either 10% or 20%. To work out which of these rates applies, the taxable gain is added to the investor’s taxable income for the year. Any part of the gain that falls within the higher or additional rate band is taxed at 20%, otherwise the 10% rate applies.
As explained earlier, most of the tax on savings and investments can legally be avoided by investing through ISAs.
So, in summary, there are two main types of tax for UK investors: Income Tax and Capital Gains Tax. Interest from savings and bonds, and dividends from shares, are taxed as income; the profit from selling something for more than it originally cost is typically taxed as a capital gain. Income and gains from some savings and investments are tax-free and, even when they are taxable, the investor may have tax-free allowances to use so that in practice no tax is due.
Tax-efficient investment means choosing tax-free products, using allowances and taking advantage of the difference in tax rates between different types of income and between income and gains – for example, choosing an investment that pays gains rather than income when gain
Week 5 quiz
This quiz allows you to test and apply your knowledge of the material in Week 5.
Complete the Week 5 quiz now.
Open the quiz in a new window or tab then come back here when you're done.
Week 5 round-up
You’ve covered a lot of ground this week, examining the types of savings and investment products in the UK that people place their money in.
You encountered some important factors that need to be borne in mind when making investment decisions – the impact of inflation and taxation as well as the different risks that are being taken with the money invested.
And you also took a step back to examine why people save money – an issue that recalled one of the core themes of the course – personal finances over the life course.
Next week focuses on another type of asset, one that for some people is an investment but that for most of us is also a home – property.
You can now go to Week 6: Housing and the household balance sheet

References
Acknowledgements
This unit was written by Martin Upton and Jonquil Lowe.
Except for third party materials and otherwise stated in the acknowledgements section, this content is made available under a Creative Commons Attribution-NonCommercial-ShareAlike 4.0 Licence.
The material acknowledged below is Proprietary and used under licence (not subject to Creative Commons Licence). Grateful acknowledgement is made to the following sources for permission to reproduce material in this unit:
Unit image
Figures
Figure 6 © iStockphoto.com/narvikk
Figure 7 © iStockphoto.com/ahlobystov
Figure 8: source unknown
AV
Managing savings and investments © NS&I
Share prices do go up and down © BBC
Every effort has been made to contact copyright owners. If any have been inadvertently overlooked, the publishers will be pleased to make the necessary arrangements at the first opportunity.
You can now go to Week 6: Housing and the household balance sheet
Don't miss out:
1. Join over 200,000 students, currently studying with The Open University – http://www.open.ac.uk/ choose/ ou/ open-content
2. Enjoyed this? Find out more about this topic or browse all our free course materials on OpenLearn – http://www.open.edu/ openlearn/
3. Outside the UK? We have students in over a hundred countries studying online qualifications – http://www.openuniversity.edu/ – including an MBA at our triple accredited Business School.