Week 1: Water content of everyday goods
Use 'Print preview' to check the number of pages and printer settings.
Print functionality varies between browsers.
Printable page generated Thursday, 18 April 2024, 7:56 AM
Week 1: Water content of everyday goods
Introduction

Transcript
Janet Sumner is your guide through this course. She is a Media Fellow at The Open University with a specialist interest in volcanoes. Janet will appear at the start of each week to tip you off about the coming highlights and challenges, to remind you what you’ve learned and to help you make the most of these four weeks of scientific discovery.
Over the next four weeks you will carry out a series of hands-on experiments. These experiments are designed to get you to:
- start thinking in a rigorous and scientific way
- recognise the influence of experiment design and variables
- think about how the world around you works.
This course is going to assume that you are new to studying science, so don’t worry if you haven’t conducted any experiments before.
The experiments start off simply, but by Week 4 you will be isolating and extracting the DNA of a kiwi fruit! This week, you’ll be focusing on why water is so important to all living organisms and carrying out two different experiments – baking a potato to destruction and examining the process of osmosis in cucumbers.
To test your knowledge you can try the end-of-week and an end-of-course quizzes.
There are plenty of opportunities to communicate with other learners. There are forum threads for activities in each week. Please join in!
Before you start, The Open University would really appreciate a few minutes of your time to tell us about yourself and your expectations of the course. Your input will help to further improve the online learning experience. If you’d like to help, and if you haven't done so already, please fill in this optional survey.
What you'll need
All of the experiments can be carried out with items you would find in a typical kitchen, but before you start, you should probably make sure you have the following:
Shopping list
- a cucumber
- a kiwi
- methylated spirits (or a bottle of vodka!)
- olive oil
- a potato
- salt
- sugar
- washing-up liquid
- yeast
- distilled water.
Equipment list
- cling film
- oven gloves
- a freezer
- an ice cube tray
- kitchen scales
- a marker pen
- a microwave or oven
- a paper clip
- a printer
- a ruler
- a vegetable peeler
- drinking glasses
- knife.
Advice for younger learners and homeschoolers
We would like to take this opportunity to remind you of the Conditions of use of Open University websites. To enrol on an OpenLearn course and participate in the forums, you must be aged 16 or over. Adults can use their own OpenLearn account to supervise under 16s on the course, posting comments on their behalf, and assisting with the experiments.
Remember, do not share any personal details such as your home address, email or phone number in any comments you post. You can read more in the OpenLearn FAQs.
1.1 Keeping a study journal
Transcript
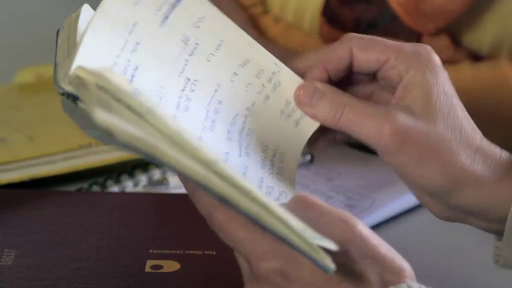
Keeping a study journal, lab notebook or field notebook is a vital skill for any scientist – beginners to the subject often underestimate their importance.
In the video, Janet Sumner and Hazel Rymer, Dean of Science at The Open University, discuss why your notes are so important. Download the activity booklet for this course, it includes everything you’ll need to make your personal notes on the experiments. If you would rather use your own journal, that’s fine – the type of record that you keep of your experiments is less important than the clarity and detail of your notes.
A good rule of thumb is that your notes should contain enough information that someone else could use them to duplicate your work, or that you could read through them years later and remind yourself of the exact procedures that you followed. It is always far better to have recorded too much information and not need it, than to not record enough and find that a vital piece of information is missing.
1.2 Introducing the experiment
One of the best ways to start thinking more scientifically is by looking at everyday items and experiences in more detail. Your first experiment will be based on an everyday process – cooking.
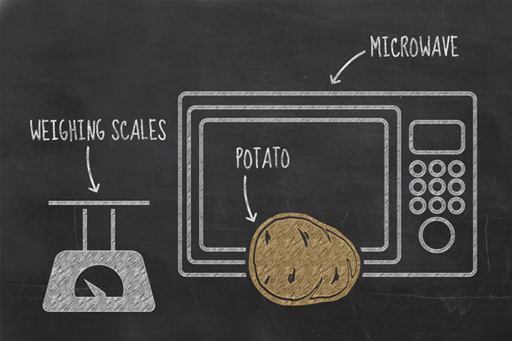
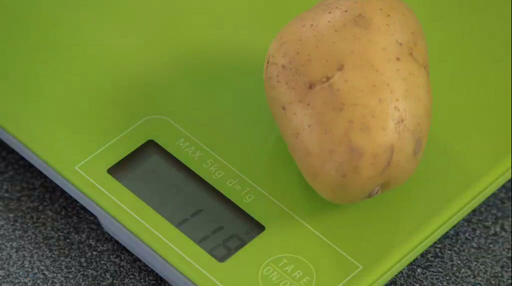
You will be looking at the relationship between heat and the water content of a potato, measuring the change in water content as heat is transferred to a potato during the cooking process.
If you have ever microwaved a potato before, you will have noticed that steam is expelled during the process. By cooking the potato to destruction you are aiming to drive off all of the water contained within it, enabling you to calculate its water content.
To conduct this experiment, you will need:
- a potato
- oven gloves
- scales (digital scales will give a clearer reading)
- your activity booklet
- a pen
- a ruler
- a microwave or conventional oven.
If you do not have a microwave oven and wish to use a conventional oven, you will need to have longer cooking times with longer intervals between readings.
Although it can reasonably be expected that most people will have similar results, there will be small differences based on the type of oven used, the type of potato, and the length of the cooking. These are the experiment variables; they are the parts of an experiment that can be controlled, changed or measured. Variables, and their importance in experiments, will be discussed throughout the course.
1.3 Drawing graphs
This experiment requires you to plot your results on a graph. Before we move on to the actual experiment, here is a quick refresher on how to plot line graphs.
Graphs are a great way of presenting numerical data visually; they are used to illustrate clearly the relationship between quantities. There are several different types of graph, but for this course you will only be focussing on how to use a line graph.
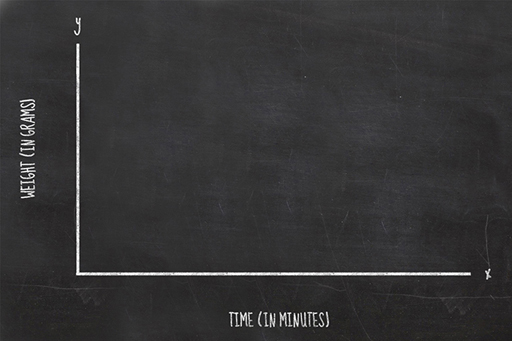
The x-axis and the y-axis
The axes on a graph are your reference lines; they carry the scale of your graph and help you locate where to plot each piece of data. They also tell you what variables your graph is illustrating a relationship between.
Line graphs are commonly used to show data that change over a period of time. A simple line graph is drawn with two axes: an x-axis that is drawn left to right across the page, and a y-axis that is drawn up the page.

Scientists like consistency and it is standard practice to put the thing you’re measuring on the y-axis. So, as the change in weight of a potato is what you will be measuring in this experiment, this will be the data plotted on your y-axis. Because you are measuring the change in the potato’s weight over time, the time will be the data illustrated by your x-axis. The graph will therefore show the relationship between cooking time and potato weight.
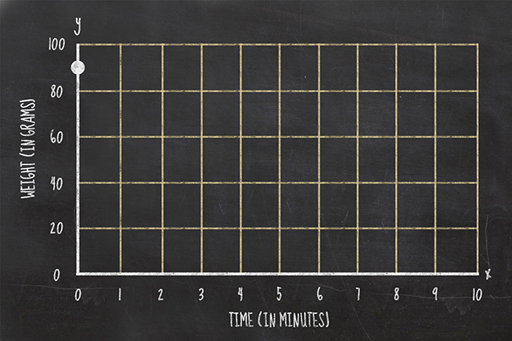
Once you have drawn the axes of your graph, remember to write alongside them both what they represent and the units they are displayed in, i.e., time (in minutes) and weight (in grams).
Setting the scale of your graph
When drawing your axes, you need to number them appropriately for the experiment you are carrying out, so your y-axis should range from zero to a number just a bit larger than the weight of your potato. Your x-axis should be labelled with the number of minutes of cooking time, probably from zero to about 10 to 15 minutes if using a microwave oven, and zero to maybe 100 minutes if you are using a conventional oven.
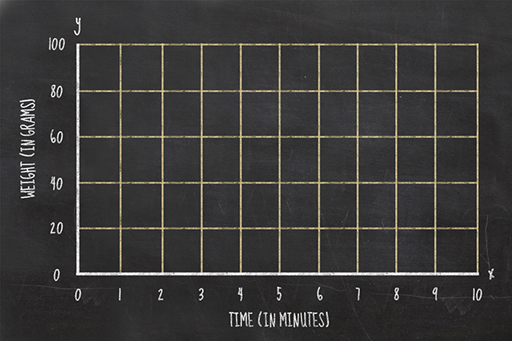
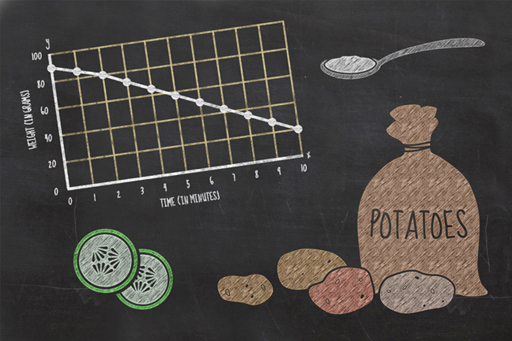
Plotting your data
When you obtain a measurement, you write down the weight and the cooking time. To plot this on a graph, you need to find where those two values intersect. For example, if your potato weighed 90 grams at zero minutes, then you would plot your first data point as a dot at the intersection between those two lines.
Once you have all your data plotted on a graph you should join the consecutive points with a line.

1.4 Experiment 1: Potato experiment
Follow Janet’s instructions in the video (or use your activity booklet PDF) to conduct the experiment. Don’t forget to prick a few holes in your potato and to use oven gloves when handling your hot potato!
Transcript
It is possible to go too far during the cooking process and cause your potato to smoke and potentially catch fire, so watch the potato during the experiment, and as soon as you see smoke coming from it, or smell burning, you should bring the experiment to a halt immediately.
This is your first opportunity to document an experiment. Remember the advice in the previous sections and record all your observations and results carefully.
You will have the opportunity to discuss your results in the next section.
1.4.1 What's in your graph?
You should now have completed this week’s experiment and should be ready to share your findings with your fellow learners. It is very likely that each of your experiments will have produced different results, but you may be able to find general patterns of agreement.
Activity 1.1 Experiment 1
What was the water content of your potato? To work this out, you just need to subtract the weight of your potato at the end of your experiment from its starting weight. The difference in the starting and finishing weights is the actual weight of the water that was in your potato.
To compare your results with those of other learners easily, you can express your potato’s water content as a percentage. To do this, divide the weight of water in your potato by the potato’s starting weight and multiply the answer by 100. It is likely to come out to about 80%.
Post your results in the course forum thread for this activity and compare your findings with those posted by other learners. Discuss why you think any differences came about. Consider the variety of potato you used. Does it make a difference? Do waxy potatoes have a higher water content than floury ones? Maybe drying in a microwave is different from drying in a conventional oven?
It might be useful to provide an image of your graph. You can do this by photographing or scanning your graph and attaching the photograph file with your forum post.
Discussions with other people are crucial parts of the scientific process. It isn’t enough to obtain your results and then hide them away; they must be shared and discussed among your peers. Scientists usually do this by having their work critically examined by other scientists to see if it is ready for publication, then publishing their results in scientific journals, where anyone and everyone can examine them. If other people disagree with those results they can carry out research, obtain findings, and publish papers which argue a different case. This is why science produces such a robust body of knowledge. Other people are always trying to spot the flaws in your ideas, and if flaws are there, they are usually found pretty rapidly. A good scientist must always be ready to be corrected.
1.4.2 Why does it matter?
Potatoes originated in South America, and have become a staple food for much of the world’s population. About 4000 to 5000 varieties exist, but most of these are only found in the Andes. In the UK, only about 80 varieties are grown, and only a handful of those are sold by the major supermarket chains.
The amount of water required to grow different crops affects which ones are better suited to drier regions, and which ones are better suited to wetter areas. With drought conditions widespread over many parts of the globe, it is better for farmers in those regions to grow crops more suited to drier conditions and crops that require less water to develop are the preferred choice.
This type of farming even has a name: dryland farming. It is common in the Great Plains of the USA, the deserts of Mexico and the south-western USA, the steppes of Eurasia, Australia, and parts of South America.
This table shows some of the thirstier crops in production around the world. Do any of these numbers surprise you?
| Water-intensive crops | Typical water needs (in litres per kg of crop) |
| Cotton | 7,000 to 29,000 |
| Rice | 3,000 to 5,000 |
| Sugar cane | 1,500 to 3,000 |
| Soya | 2,000 |
| Wheat | 900 |
| Potatoes | 50 |
1.5 Experiment 2: Cucumbers and osmosis
In the previous experiment, you determined the water content of a potato and illustrated the rate at which the water is driven off in your graph. You also developed skills in carrying out an experiment. You’re now going to carry out a second experiment looking at the way water gets in and out of cells.
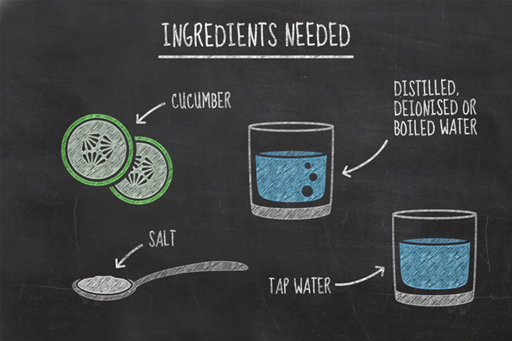
In this experiment, you will be measuring changes in the water content of two slices of cucumber as they are left in two different liquids; distilled water and salty water.
To carry out this experiment, you will need:
- two slices of cucumber
- two glasses
- a knife
- a peeler
- tap water
- distilled, deionised or boiled water
- two tablespoons of salt.
It is best to use distilled water for this experiment, available from most petrol stations and car spares shops. Distilled water is simply water that has had most of its impurities removed by boiling it, then collecting the steam and condensing it in a clean container. An alternative is deionised water, sometimes called demineralised water. This is similar to distilled water, but the manufacturing process does not significantly get rid of organic molecules, viruses or bacteria. If you can’t get hold of either of these, you can use boiled water that has been left to cool to room temperature instead.
While it’s okay to drink small quantities of distilled and de-ionised water, we don’t recommend it. Why do you think the purest form of water might not be good for you? Perhaps you’ll be able to see why at the end of the experiment.
Follow Janet’s instructions in the video (or use your activity booklet PDF) and remember to keep clear and accurate notes in your journal. Once again, think about the variables that could affect your results.
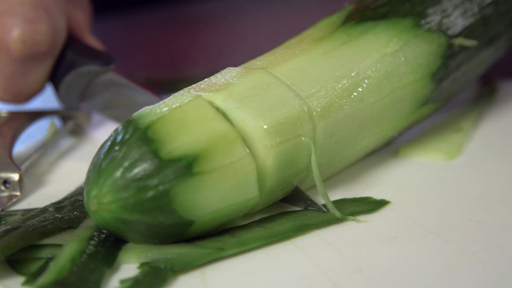
Transcript
Based on her initial findings, Janet decided to change the parameters of her experiment and leave her cucumber slices overnight. You may find that you have to do the same. If so put the experiment somewhere where no-one can knock it over, and no pets try and drink it.
You’ll have the opportunity to discuss your findings in the next section.
1.5.1 Sharing your results
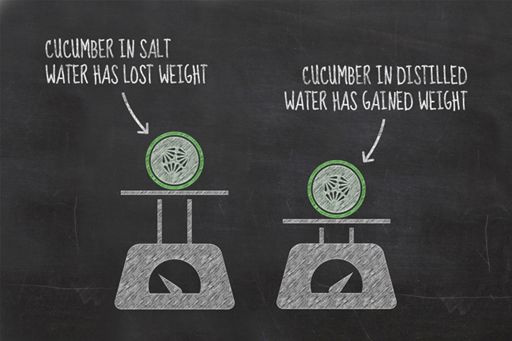
Now that you have completed your second experiment, you will have a new set of results to discuss. Hopefully the results of your experiment were broadly similar to those seen in the video. The cucumber slice in the salt water should have lost weight, while the one in the distilled water should have gained weight.
Activity 1.2 Experiment 2
Post your results and observations in the course forum thread for this activity:
- Did the experiment perform as you expected?
- What do you think caused your cucumber slices to change in the way that they did?
- If your cucumber slices haven’t behaved in the same way as Janet’s did, can you think of a reason why your results might be different?
Photographs can be really useful for comparing your results, so do add an image to your forum post if you can.
Remember, if your results were unusual this does not make them bad – some of the most significant scientific discoveries have stemmed from mistakes or surprises.
1.5.2 Osmosis explained
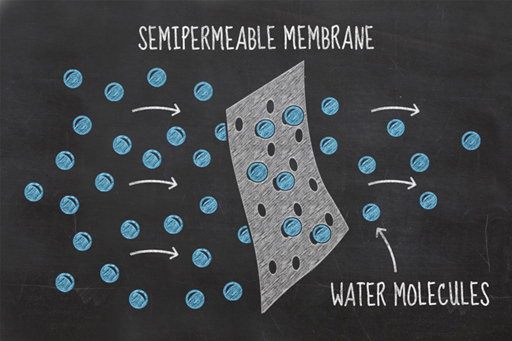
You’ve seen the results of your experiment and it should be clear that water is somehow moving in and out of your cucumbers – this process is known as osmosis.
Imagine two solutions of different concentrations, divided by a partition which allows small particles through it, but not large particles. This type of boundary is known as a partially permeable membrane. In this environment, the process of osmosis will occur spontaneously because the concentrations of water molecules on either side of the partition, or membrane, naturally try and equalise.
In your experiment, the water in the glass and the fluid inside the cucumber’s cells are separated by the cucumber’s cell walls which are partially permeable membranes. Salt cannot pass through these membranes, but water can. By adding salt to the water, you made its salt concentration higher and therefore lowered the concentration of water in the mixture. This gives the cucumber cells a relatively higher water concentration than that in the glass. The water in the cucumber cells tries to equalise these different concentrations by moving from the cells to the saltwater solution. As a result, the cucumber loses water and becomes a bit squishy. This environment is referred to as hypertonic.
In your other glass, containing the distilled water, the opposite effect was seen. Water flowed from the pure water (a higher concentration region) into the cucumber cells (which have a lower concentration of water). In this hypotonic environment, the water tries to equalise by moving into the cucumber cells, inflating them, and causing the cells to become firm. This is known as turgor, and it is the turgor pressure in plant cells that keeps them rigid. Without it, plants wilt and their cellular functions will begin to decline.
When the concentrations on either side of the membrane are equal, the condition is known as isotonic, and water moves randomly from one side of the membrane to the other, but with no pressure gradient to drive it, the rate is the same in both directions.
1.5.3 Why does it matter?
You now know what osmosis is and that it’s the process that keeps plants firm but, other than keeping your flowers from wilting, are there any other examples of osmosis in the natural world? Unsurprisingly, the answer is yes, there are many, and here are just a few:
- As well as keeping plants rigid, osmosis is also the way that plants draw water and nutrients into their roots.
- If you’ve ever stayed in the bath too long and seen your fingers turn a bit ‘pruney’, it’s because your fingertips have absorbed water through osmosis and become bloated, making them wrinkly.
- Ever had salted fish? The fish is covered with salt to preserve it. Osmosis is the process whereby the salt draws water from the fish’s cells, drying it out. This, gruesomely, is the same thing that happens when slugs encounter salt.
- If you have soaked raisins overnight in alcohol for a recipe, the liquid soaked into the fruit by osmosis.
- Cholera is rare in developed countries, due to clean water supplies and good healthcare, but it used to be one of the most feared diseases in the world. Cholera damages our intestines in such a way to cause osmosis to happen in an unwanted direction. The cells of the intestine become unable to absorb water and instead it flows from the rest of the body into them, causing diarrhoea, dehydration and often death.
- Industrially, osmosis is used to purify water, at desalination plants where seawater is turned into drinkable water.
- Osmosis is also used in modern medicine. When patients are treated with dialysis to replace lost kidney function, osmosis is the process which is used to filter waste materials and excess water from the blood.
Now, you may remember that Janet mentioned a green energy source in this week’s guide video. Well, this relates to the use of osmosis to generate electricity. Where rivers flow into the ocean, freshwater and saltwater naturally meet, resulting in a natural mixing of waters of different salinity. Construction of a power plant at such a site allows freshwater and saltwater to be guided into separate chambers, divided by an artificial membrane. At the membrane, the freshwater is drawn towards the seawater. This flow puts pressure on the side of the seawater and that pressure can be used to drive a turbine, producing electricity that produces no greenhouse gases. The only waste product is brackish water (a mixture of saltwater and freshwater), which can be pumped out to sea.
Power plants that utilise osmosis in this way have been trialled, but only as prototypes, as the technology is still relatively new. The first was in Norway, where it generated up to 4 KW; barely enough to keep a couple of houses supplied with power, and the company shelved their development plans. However the technology can still be developed further, if improvements in the efficiency and cost of the membrane can be achieved.
Those are just a few examples of osmosis in real life, can you find some more? .
1.6 Week 1 quiz
Check what you’ve learned this week by taking this end-of-week test.
Complete the Week 1 quiz now.
Open the quiz in a new window or tab then come back here when you're done.
1.7 Week 1 summary
Congratulations, you have completed Week 1 and carried out two different science experiments. You should be starting to get a taste for practical science and sharing data; hopefully you have learned some new things too!
During the week you have covered scientific techniques such as making precise measurements, recording data and observations, plotting graphs, and interpreting results. These are all essential skills for a scientist and you will use them throughout this course.
We hope that you have enjoyed this first week and you should now be ready to tackle Week 2, where you will investigate some properties of different liquids.
To conduct next week’s experiment, you will need:
- an ice cube tray
- fresh water
- salt water (approximately 2 tablespoons of salt added to 500 ml of water)
- olive oil
- another liquid of your choice – be creative here, but avoid substances which might be hazardous!
- four glasses
- your activity booklet
- a freezer.
You can now go to Week 2.
Acknowledgements
This course was written by Hazel Rymer.
Except for third party materials and otherwise stated in the acknowledgements section, this content is made available under a Creative Commons Attribution-NonCommercial-ShareAlike 4.0 Licence.
Course image: alinakvaratskhelia / www.123rf.com
Every effort has been made to contact copyright owners. If any have been inadvertently overlooked, the publishers will be pleased to make the necessary arrangements at the first opportunity.
Don't miss out:
1. Join over 200,000 students, currently studying with The Open University – http://www.open.ac.uk/ choose/ ou/ open-content
2. Enjoyed this? Find out more about this topic or browse all our free course materials on OpenLearn – http://www.open.edu/ openlearn/
3. Outside the UK? We have students in over a hundred countries studying online qualifications – http://www.openuniversity.edu/ – including an MBA at our triple accredited Business School.