Quantitative and qualitative research in finance
Use 'Print preview' to check the number of pages and printer settings.
Print functionality varies between browsers.
Printable page generated Wednesday, 1 April 2026, 3:50 AM
Quantitative and qualitative research in finance
Introduction
This free course, Quantitative and qualitative research in finance, provides you with a good sense of the guiding ideas behind qualitative and quantitative research, of what they involve in practical terms, and of what they can produce. It outlines some of the key features both in terms of how the data are produced and how they are analysed. It also considers some ethical aspects of research that you should have in mind.
This OpenLearn course is an adapted extract from the Open University course B860 Research methods for finance.
Learning outcomes
After studying this course, you should be able to:
distinguish between qualitative and quantitative research
identify different sampling approaches
distinguish between primary and secondary data sources
interpret the political and ethical aspects in financial research.
1 What is qualitative research?
While it has become common to distinguish between qualitative and quantitative approaches, some researchers argue the need for combining these two types of method, and there are those who challenge the distinction itself. For example, they argue that it obscures both the considerable diversity that exists under each heading and also important overlaps. These are certainly vital points to be aware of, but the distinction between qualitative and quantitative approaches nevertheless points to some significant differences in orientation among social researchers.
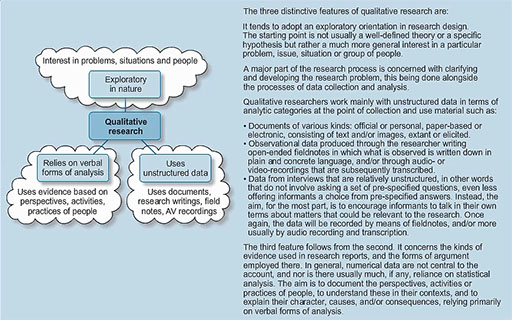
It is important to identify the key features of a qualitative approach. The points in the following video give you an initial idea of the three distinctive features of qualitative research.
If you are finding the text in the video too small to read, you can see the full text in the video transcript.
Transcript
There is some truth in that qualitative and quantitative research are each suitable for answering different types of questions. For instance, if we are interested in capturing the systematic component of risk for securities held by ordinary investors, then we must necessarily engage in quantitative investigation. By contrast, if we were asked to provide an account of how ordinary investors perceive of risk then qualitative research is the best approach. However, much qualitative and quantitative research is actually concerned with answering similar sorts of questions. In such cases, the adoption of one approach rather than the other usually stems from what the researcher believes to be necessary in order to produce an adequate answer, and/or from the nature of the data that are likely to be available.
2 Three broad approaches in qualitative research
The qualitative approach to research is focused on the subjective assessment of attitudes, opinions and behaviour. This approach generates results either in non-quantitative form or in a form which is not subjected to rigorous quantitative analysis. Techniques such as focus group interviews, projective techniques and in-depth interviews are generally used. Qualitative research requires greater clarity of goals during the design stages. In order to make sense of the considerable diversity, and even division, to be found within the field of qualitative research, we will sketch three broad approaches, each of which has shaped a great deal of qualitative work. We will call these approaches:
- investigating personal experience
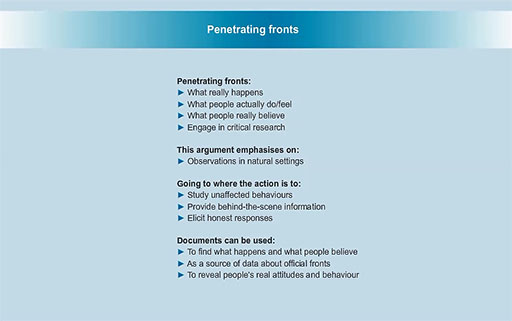
- penetrating official fronts or conscious motives
- documenting discursive strategies.
While we will discuss them separately here, it should not be assumed that they are distinct in practice; in fact, researchers often combine them in various ways.
Activity 1
Watch the following videos and make notes on the basic characteristics of each qualitative research orientation.
Again, if you are finding the text in the videos too small to read, you can see the full text in the transcripts for each video.
Investigating Experience
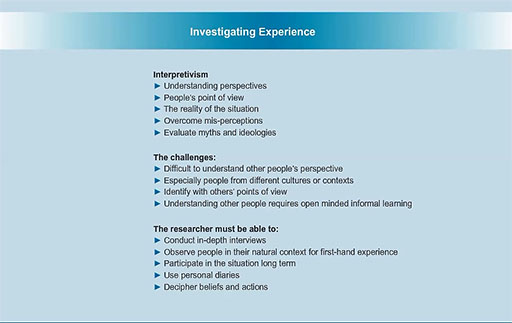
Transcript
Add your notes here summarising the main arguments of this approach.
Penetrating fronts − Part 1
Transcript
Add your notes here summarising the main points of the above approach.
Penetrating fronts − Part 2
There are reasons why, from the point of view of this second approach, interviews may not give us access to the data we require. Can you think of any? Write down your thoughts and then compare with the feedback provided.
Discussion
First, and most obviously, people will not necessarily tell us the truth in interviews about how they feel, what they think, or what they do.
Second, they may not know these things. One reason for this is that, as indicated earlier, much of our everyday behaviour is below the level of consciousness, we are not aware of key aspects of it, because we do not have to concentrate on these in order to carry it out. There are also some arguments to the effect that many aspects of our feelings and behaviour are obscured from us by psychodynamic processes, that these prevent us from recognising important facts about ourselves because doing so would be painful. These processes may be particularly powerful where we are asking people to describe their past lives, or events in the past, since we know that memory is selective and reconstructs our experience rather than simply re-presenting it. Furthermore, where informants provide accounts of other people’s behaviour, these are likely to be filtered through pragmatic concerns that will only take account of a small part of what those other people do or feel, and which may well be very crude or even inaccurate representations of their attitudes, beliefs, and behaviour.
Third, people may not be aware of the remoter causes or consequences of what they do. It is sometimes argued that only a researcher who places someone’s behaviour within a broader context, in both historical and social terms, will be able to reveal these. Moreover, many arguments about human social behaviour link remote causes and consequences in functional relationships: it is argued that particular social practices become established because of the consequences they typically have, these feeding back to reinforce the practices they serve. The people involved in such functional social processes may not be aware of them. For example, patterns of social inequality may be reproduced in this way.
Finally, those adopting a constructionist orientation would point out that the accounts that informants provide in interviews are produced to serve particular discursive functions in the course of the interview, that they reflect the role of the interviewer (what questions were asked, how, and so on), and the particular way in which the interview developed as an interactional situation. From this they often draw the conclusion that to expect that interview accounts could ever represent some independent reality existing beyond the interview situation is an illusion.
All of these considerations can lead to scepticism about the accounts people provide in interviews; though in our view they by no means rule out the use of interviews entirely.
Documenting Discursive Strategies
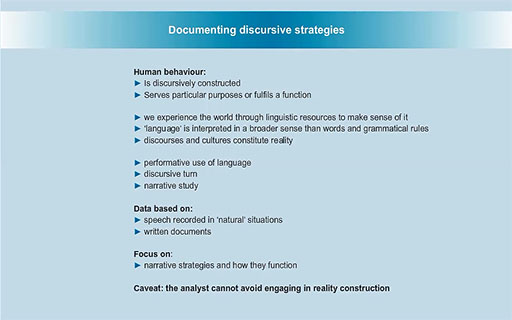
Transcript
Add your notes here summarising the main arguments of the third approach.
2.1 General assessment of qualitative research
The three different approaches of qualitative research offer a sharp contrast with the positivist ideas underpinning much quantitative work, where the aim is often to produce reliable measurements of controlled variables from which widely generalisable conclusions can be derived or against which theoretical or explanatory hypotheses can be tested.
There is no doubt that in social sciences, in particular in the discipline of economics, quantitative research (and mathematical formalism) enjoys more respect. This reflects the wide-held belief that science has to relate to numbers because only the latter imply precision. Nevertheless, it is important to highlight the fruitfulness and, often, the greater depth of understanding we can derive from qualitative procedures.
Equally important, though, is that these three qualitative orientations are in conflict with one another at various points.
The first treats what people say as a way of seeing into distinctive personal or cultural worlds, perhaps ones that only make sense in their own terms, not in any framework that the researcher initially brings to them. By contrast, the second approach adopts a more critical attitude: the researcher is concerned with the reality that lies behind the fronts that people present, or what they consciously believe, and this may only be detectable by ignoring what they say in order to understand how this betrays an underlying reality and/or by observing what they actually do. Where, in the case of the first approach, we must accept what people say on trust even if initially it does not make much sense to us, expecting that it is in principle possible to understand it as rational, in the second approach we must be suspicious of it even if it apparently makes good sense. Indeed, we should perhaps be especially suspicious in these circumstances, since it may just be a highly effective rationalisation. The third approach is at odds with both of the other two. It denies the existence of, or at least the possibility of accessing, both the ‘subjective realities’ of other people, how they truly see and feel about the world and the well-springs of their actions, and the existence of some objective reality behind the fronts they put up or myths about themselves and others that they believe. Rather, the focus must be on the accounts themselves, how they are constructed, and what functions they may serve.
Despite these sharp contrasts among the three approaches, as we noted earlier, in fact much qualitative research draws on more than one of them. To some extent this arises from the fact that qualitative researchers do not always pay very close attention to the methodological assumptions on which they are operating, but it is also because there are some links between, or overlaps across, these orientations. For example, the kind of analysis developed under the auspices of the third approach can be used for analysing the fronts that are of interest from the point of view of the second. Another way in which more than one of these approaches can be drawn on, despite their incompatibilities, is through their being applied to different individuals, groups, or categories of actor. For instance, the first orientation could be applied to those people with whom the researcher has some sympathy, while the second might be applied to those for whom he or she has little sympathy. Whether or not this is legitimate is a live issue. Furthermore, there is a tendency sometimes for the third orientation to be applied to those accounts that the researcher assumes to be spurious – on the (mistaken) assumption that because an account can be shown to be a construction it is false. Moreover, even the accounts of the same person can be subjected to all three sorts of orientation in a selective way: some parts being viewed as genuine, while others are treated as fronts or as constructed accounts. We should note that none of these strategies for combining the approaches eliminates the tensions entirely, and that there is an absence of clear guidelines as to when one orientation or the other ought to be applied.
Activity 2
This activity discusses a qualitative research project on the common understanding of risk. A detailed description of the research project can be found in the following green paper.
The research was conducted by Sharon Collard, professor of Personal Finance Capability in the True Potential Centre for the Public Understanding of Finance (PUFin). PUFin is a centre for research working to improve public understanding of personal finance established by the Open University Business School. It also delivers free modules providing individuals with the tools to make sound financial decisions. You can find more on the activities of PUFin and offered MOOCs (massive open online courses) on the PUFin website.
Go through the green paper and try to understand the different steps in the planning of the qualitative research project: the motivation, the key questions, the overall research approach, the sample, the structure of questionnaires, and the interviewing process. Then, answer to the following questions:
Question 1
What was the motivation of the project?
Add your notes here.
Discussion
This feedback comes from professor Sharon Collard:
The motivation really was that we have very good evidence already that consumers in the UK are generally quite unwilling to take risks with their money when it comes to saving and investing and that’s perhaps not very surprising that they don’t really want to take much risk. But we also know that people have a fairly poor understanding of the nature of financial risks and I think it’s that lack of understanding that we find worrying, because people in the UK and in other countries now have to make some really important financial decisions that will affect their financial future so they need to decide where they are going to invest their pension savings for example and perhaps how they’re going to use their pension savings when they come to draw on them later in life. And there are also now in the UK and elsewhere many more opportunities for people to be kind of do-it-yourself investors, in order to choose and to buy investments without taking any professional advice at all. So really with these developments we thought it was a really good time to look at this issue about people’s understanding of risk in a good deal more detail. And also we wanted to look at the subject of risk from the perspective of the financial advice industry and in particular how the industry assesses people’s attitude to risks and the tools that it uses. And the tools that it uses are called risk profiling tools and that might be a term that’s not familiar to people listening and so risk profiling tools really comprise firstly a questionnaire that is administered to a client when they go to see a financial advisor and so the – the financial advisor would give them a questionnaire to complete either at the session or they might go away and complete it at home. And once they’ve completed this questionnaire behind the scenes what happens is there are algorithms so there are mathematical formula that are used to score the client’s answers to the questionnaire and what that does is to calculate a risk profile for the client that the advisor can then use to help select an appropriate saving or investment product or products. So we’re looking at both those things really. It’s both people’s understanding of risk and also how the financial services sector assesses people’s attitude to risk.
Question 2
What are the key research questions and how were they investigated? Is this a quantitative or qualitative research?
Add your notes here.
Discussion
This feedback comes from professor Sharon Collard:
So we really wanted to address four key questions in the research. The first one was what do people understand by the – by the term ‘risk’ in relation to saving and investing and what are the things that kind of inform that understanding? How have they come about that the understanding that they have?
The second one is looking at the extent to which risk profiling tools that the financial advice sector uses, how well do they reflect people’s own understanding of risk?
And the third one is really around whether there’s scope to improve risk-profiling tools to provide a better indicator of people’s attitude to risk. So are there some improvements that we could suggest from our research that would make those tools work a bit better?
And the final one really is there anything else that could be complementary to the risk profiling tools that would help people to understand their own attitude to risk and that they could really use themselves to help them make good decisions and get good outcomes.
So in order to answer those research – four – sorry – in order to answer those research questions we have used mainly a qualitative approach to answering them because what qualitative research allows us to do is really get an in-depth understanding of people’s views and experiences through interviews in this case. And what qualitative research is really valuable for is really getting a depth of understanding that you can’t get from a survey where there are mainly closed-ended questions. So it’s really about having a fairly open discussion with participants in order to understand in great detail the topic that you’re interested in. So it was mainly qualitative research that we’ve done but we also conducted a review of the literature and some other evidence that we – we found in relation to the subjects we were interested in and we also conducted some analysis of the attitude to risk questionnaires that are used actually in the financial advice industry to really understand what sorts of questions are asked and how those questions are constructed and those complemented the qualitative interviews that we did.
Question 3
What would be the structure of the sample of people that you would interview?
Add your notes here.
Discussion
This feedback comes from professor Sharon Collard:
We conducted in-depth interviews with three different groups of people for the research. So the first group was a group that we call stakeholders. So these are people who have an interest in the subject, they were representatives from the UK financial regulator, which is called the Financial Conduct Authority, and we also talked to a number of organisations that represent consumers and advocate for consumers who are particularly interested in financial issues that consumers might face. So that was the first group.
The second group was people who were actually working in the financial advice industry. They are mainly financial advisors and these are people then who give advice to clients about investments and other regulated financial products and they use day to day in their jobs these risk profiling questionnaires and tools that I talked about earlier. And we also, within that second group of people in the financial advice industry we also spoke to one or two people who actually work on developing risk profiling tools to get their perspective.
And the third group, the really important group that we spoke to were members of the general public and these were people who had recently taken out or considered taking out an investment because what we really wanted was people who had some recent experience who could talk to us about how they made their decisions to take out that investment.
Question 4
With regard to the questionnaires, how would you envisage their structure? What do you believe they should capture?
Add your notes here.
Discussion
This feedback comes from professor Sharon Collard:
Because these were full in-depth interviews, we would never use a kind of structured questionnaire for this as you would have perhaps in a survey where a survey would have fixed response codes that people answer. You might have a question and then six responses that you want people to fit their answer into. So this is quite different. This is much more open-ended. It’s much more a discussion and a conversation with people. So for qualitative research and for in-depth interviews in particular what we use are topic guides and topic guides or discussion guides as they’re sometimes called comprise the sorts of main questions and topics that you want to talk to people about. And in this case, because we had three different groups of people that we were talking to we had one topic guide for each of the three groups and they were all slightly different as you might imagine.
The purpose of a topic guide really, it’s there to make sure that we cover all the main issues so it’s not supposed to be a script. You don’t have to stick to it word for word. And the main job really of the interviewer in using the topic guide is to listen quite carefully to what the respondent is saying and pick up on any cues from the respondent. For example, to ask some follow up questions or to get more details or to get some clarification about what they’re saying. So it’s really there to make sure that we as interviewers as gathering as much information as we possibly can but it’s in an open and fairly unstructured way. And so what that gives you is some discretion to ask follow up questions if you think something is particularly interesting but it’s not necessarily on the topic guides then you know you need some discretion to follow that up because it might be relevant to the research. So in order to be a good interviewer you’ve got to know when it’s appropriate to use that discretion and to know in detail what it is you want to get out of the interview because it’s by listening and probing and asking follow up questions that you really do get the most out of – out of qualitative interviewing.
Question 5
The main findings of this research have been published in this white paper.
Transcript
Listen to the audio, add your own notes and then read the discussion.
Discussion
A detailed description of the research project can be found in the following green paper.
Go through the paper again and revisit the corresponding parts in the audio discussion. Try to understand the different steps in the planning of the qualitative research: the motivation, the key questions, the overall research approach, the sample, the structure of questionnaires, and the interviewing process. At the time of the interview, this was ongoing research.
3 Introduction to quantitative research
Our aim in this section is to provide a general introduction to some of the basic principles of quantitative research.
Quantification is involved in many of our ordinary dealings with the world in everyday life and is not restricted to science. We count things, and we may also judge them in terms of degree; and we use various technological devices, from rulers to clocks, to help us in doing this. We also deploy quantification in making sense of our own and of others’ behaviour. We think about how often we go to the gym, pray, have sex, and so on; and we also talk about how strongly we or others believe in various things, how effective teaching has been, how powerfully events affected us, who does most work, who has more and less power or freedom, and so on.
At the same time, it is also true that in the twentieth century there was huge growth in the production of quantitative data in modern societies, both within and outside of social sciences. Finance is a discipline associated from its very beginning with quantitative data and related research. Given recent trends in high frequency trading (HFT), databases with trillions of observations are now commonplace in financial firms.
To some extent, there is always the danger of a misplaced ‘trust in numbers’. Quantitative research has been closely associated with attempts to make modern social and economic institutions more publicly accountable in terms of their performance and outcomes. Almost all quantitative researchers would probably agree that there are examples of quantitative data produced about important matters that are of doubtful, or even negative, value because the data do not accurately represent what they purport to capture. At the same time, most qualitative researchers would not deny that quantification is appropriate in relation to some social phenomena.
4 Sources of quantitative research
In thinking about any kind of data, we need to give attention both to how it was produced and to the purposes for which it is to be used, in other words what inferences it is being or will be employed to make. These two aspects need to be considered together, since each has implications for the other.
It is important to recognise the diversity of sources and forms of data used in quantitative research. One source is available statistics or secondary data sources (including what are often called ‘official statistics’). These consist of numerical data that have been produced by various organisations and agencies – publicly funded bodies of various kinds, commercial organisations, interest groups – as well as nation states and international governing institutions like the European Union. Equally important are bodies of quantitative data produced by previous social science research projects. These are often available in data archives and it may be possible to re-analyse them in order to address somewhat different questions from those with which the original studies were concerned.
Instead of, or as well as, relying on already available statistics, researchers often produce quantitative data for the purposes of particular projects: this is a primary data source. This usually involves data being structured at the point of collection in a form that allows counting and/or measurement. For example, information may be collected about the frequencies of various kinds of events through use of an observation schedule. Similarly, psychological tests or fixed-choice questionnaires may be employed to measure abilities or attitudes across a sample of people. However, it is worth pointing out that some of the sorts of data used by qualitative researchers, such as written documents and transcripts of audio or video recordings, can be subjected to quantitative analysis after being collected. This involves developing and applying a structure of categories that allows counting, ranking, or measurement. One example of this, usually applied to written documents, is content analysis. Answers to free response items on questionnaires, and sections on observational schedules requiring open description, also have to be structured in this post hoc way if they are to be used for quantitative analysis.
5 Using available statistics
Sometimes, quantitative data are generated as a normal part of the operation of an organisation, as in the case of financial statements published by public organisations. Other data, however, are specially collected by organisations as an adjunct to their work: for example, most governments produce a considerable amount of statistical data about the societies in which they operate, which is used as a basis for policymaking. There is also quantitative data produced by inspection and auditing organisations. As noted earlier, there are also sets of data generated by previous research studies.
Available quantitative data, of these various kinds, can be a very important source of evidence for researchers. Indeed, often they will provide information that it is simply not possible to obtain otherwise, or that would be prohibitively expensive for an individual researcher to try to collect. At the same time, usually they will by no means provide all of the sorts of information that are important for a particular study. The available data, having been gathered for a different purpose, may not exactly fit the requirements of a particular research. At the same time, quite often underlying assumptions and definitions are not made clear in the publication of secondary data.
Activity 3
Much of the research in finance is based on secondary data sources that researchers do not collect themselves. In fact, researchers now have access to an unthinkable amount of financial and economic data, some of which are publicly available without any cost. You can check out some interesting online data sources (from either international organisations or well-known individual researchers), which are quite user-friendly and do not require any subscription (you can download data for free):
- Statistics of BIS. The Bank for International Settlements (BIS) is an international organisation that serves as a bank for central banks aiming at international monetary and financial cooperation. On its website it offers several financial data series including data on: banking, basic financial securities, derivatives, exchange rates, property prices, credit to private sector and some global liquidity indices.
- OECD statistics. The Organisation for Economic Co-operation and Development (OECD) is an international economic organisation of 34 countries founded in 1961 to stimulate economic progress and world trade. From its online database one can easily download a wide range of data from economics and finance to demography, social protection and well-being.
- Eurostat database. Eurostat is located in Luxembourg and its main responsibilities are to provide statistical information and promote harmonisation of statistical methods across European Union member states. The user can find some key macroeconomic and financial series.
- The World Top Incomes Database. The World Top Incomes Database aims at providing convenient online access to all the existent historical series on the distribution of top incomes using tax data for several countries. It also provides information on the distribution of earnings and the distribution of wealth.
- Online data of Robert Shiller. [
 ] Robert Shiller is an American academic economist, well-known for his research on the efficiency of financial markets and behavioural finance. He jointly received the 2013 Nobel Prize in economic sciences (with Eugene Fama and Lars Peter Hansen). His online dataset offers some interesting long term time series such as: monthly stock price, dividends, earnings data and the consumer price index starting from January 1871 for the US stock markets; historical housing market data in the US since 1890; annual series for long-term stock, bond, interest rate and consumption data since 1871.
Take some time to familiarise yourself with the above online data sources. Download some of the economic or financial variables and plot them on graphs using Microsoft Excel.
Discussion
Here are some suggestions:
From BIS statistics: you can trace and download the available data for credit to private sector for the UK. On the main homepage of BIS select ‘Statistics’ and then ‘Credit to private sector’ from the menu on the left hand side. Read the brief description of the database and select ‘Data’; the dataset will automatically open in Microsoft Excel. In the second worksheet, named ‘Documentation’, you can locate the links to the time series for the UK private debt of ‘households and NPISHs’ and ‘non-financial corporations’ (note that NPISHs stands for Non Profit Institutions Serving Households; choose the ‘adjusted for breaks’ time series).
Copy and paste the relevant variables to a separate new spreadsheet. Then plot the size of credit to households and NPISHs and non-financial corporations. The data is provided quarterly and the numbers are expressed in billions of pounds. Use the series that are adjusted for breaks in order to make safer historical comparisons. The figure below should look similar to yours. Have in mind that you present the actual size of debt in millions of pounds.
A better understanding of the developments in private indebtedness would require us to plot debt as a ratio if income or GDP were available. For instance, you can find quarterly figures (in order to match the frequency of the debt data) of UK GDP in the OECD database (see below). Our attached spreadsheet contains both GDP data and the corresponding debt of households and non-financial corporations as ratios to GDP.
The second figure below presents the results. The debt of households and non-financial corporations was increasing from the beginning of the 1980s reaching 100% of GDP just at the outbreak of the 2008 global financial meltdown. The crisis originated a deleveraging phase for the private sector as is obvious from the same figure.


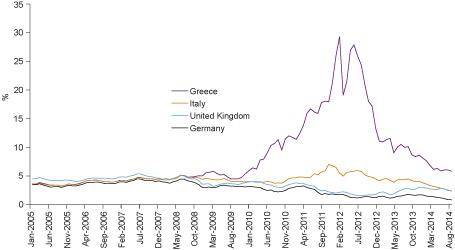
OECD statistics: From this very rich data source we can plot the long term government borrowing costs (or, alternatively, the long term interest rates) for some countries.
The figure below shows the trends of monthly prices of long term annual interest rates for the UK, Germany, Italy and Greece from January 2005 to September 2014. You can find these time series as follows: from the menu of the main OECD webpage select consecutively: ‘Finance’ > ‘Monthly financial statistics’ > ‘Monthly monetary and financial statistics’ > ‘Long term interest rates’. Then you can customise your search specifying several criteria: time, countries etc.
When you finish your search you can export the selected time series into a Microsoft Excel spreadsheet from the menu on the top of the table simply by choosing ‘export’.
When you download the data, they will have the standard OECD structure and format. You can easily reorganise them into a different spreadsheet.
You can see that before the outbreak of the 2008 financial meltdown, these four countries were having similar borrowing long term costs. Risk repricing in the wake of the crisis radically reshaped the trends triggering a serious sovereign debt crisis in the Eurozone.
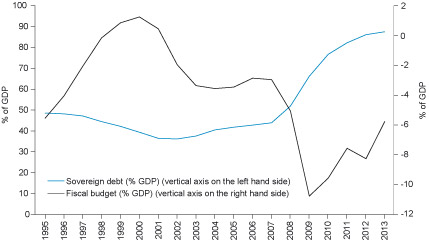
Eurostat database: From this database, for instance, we can have a look at the UK sovereign debt and budget. The figure below shows these variables as percentage of GDP.
To find the variables, in the main Eurostat webpage select ‘Data’ and then ‘Database’. In the next page select the category ‘Economy and finance’ and then: ‘Government statistics’ > ‘Government finance statistics’ > ‘Government deficit and debt’ > ‘Government deficit/surplus, debt and associated data’. A new webpage will pop up and then you will be able to specify your selection according to several criteria: country, variable, sector, time and unit of measurement.
After you specify your search you can download the data from the menu in the top of the webpage. Given the amount of information in the Eurostat database, it may take some time to familiarise yourself with the working environment and be able to specify your selection.
The downloaded data will have the standard Eurostat structure and format. You can easily reorganise them into a different spreadsheet.
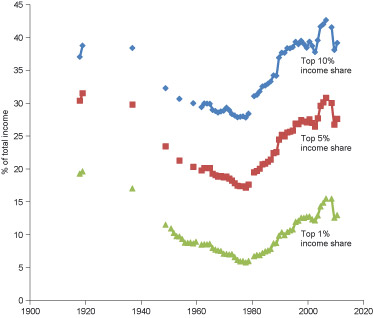
The World Top Incomes Database: One of the key themes in contemporary discussions in academic literature and financial press is the increase in income and wealth inequalities associated with the post-1970s financial innovations.
This database summarises valuable information about the historical trends in inequality for many different countries. You can find and plot the time trends of the top 1%, 5% and 10% income share for the UK.
In the main webpage you choose ‘The Database’ and then in panel 1 of the next webpage you choose ‘United Kingdom’. In panel 2 you define the time range. Data are available from 1908 to 2011, although series before 1960 are incomplete.
In panel 3 you select the variables that you would like to download: ‘top 10% income share’, ‘top 5% income share’ and ‘top 1% income share’. When you press the ‘download’ button you can automatically get the selected time series in a Microsoft Excel spreadsheet.
Note that there are two different layouts and you can find information about them in the first spreadsheet. You can plot data of layout-A synthesising the available time series before and after 1990. The three variables are shown in the figure below.
The figure presents a clear rise in income inequalities in the last three decades, particular after the 1980s. The same tendency also characterises other developed capitalist economies. Note that for many years relevant data are not available. You can repeat the same exercise for the same (or other) variables in different countries and make comparisons.
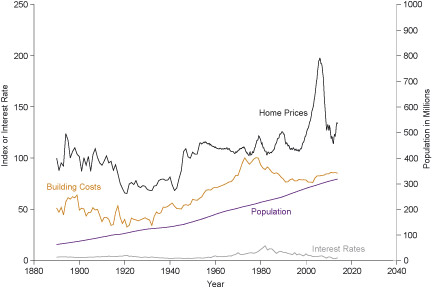
From Robert Shiller’s database: The database offers long term monthly historical trends in US home prices from 1890 to the present. To download the time series just press ‘US Home Prices 1890-Present’ on the main webpage and open the file with Microsoft Excel. These trends are already plotted in the first spreadsheet against historical trends in building costs, interest rates and population. Related data can be found in the second spreadsheet of the same file.
The figure captures the recent price inflation in the US house market which was associated with the 2008 financial meltdown. Changes in home prices cannot be easily explained by the trends in building costs, interest rates or population growth.
Note that ‘home prices’, ‘building costs’ and ‘interest rates’ are indices and measured by the vertical axis on the left hand side of the figure.
Activity 4
Having in mind the above discussion on quantitative research, what problems can you identify in using available statistics in general?
Add your notes here and then compare them with the feedback provided below.
Discussion
There are several issues that need to be taken into account in using available statistical data:
- First, we must remember that the available data have not always been produced for the particular purposes for which they are now to be used in a research project, and that the functions they were generated to serve may have shaped them in ways that are relevant to their interpretation. Furthermore, while data are produced by organisations in order to provide important information on the basis of which they will make decisions, they are also sometimes produced for self-justification or propaganda purposes. In addition, there may be different levels of commitment to producing sound data on the part of those in different positions in an organisation. Indeed, some people may have a motive for systematically manipulating the data, for example where their performance is being measured. It is also the case that, very often, organisations, including governments, do not deploy sufficient resources for high quality information to be produced. As a result, there may be missing data and some error in available statistics. In government statistics published at regular intervals, these and other factors often lead to variation in modes of presentation that can seriously hinder the investigation of changes over time. How important these failings are depends upon the purposes for which the statistics are to be used.
- A second set of problems that needs to be taken into account in the use of available statistics is the fact that the availability of particular sorts of data (and not others) may shape the course and focus of research in a field. For example, while the rise in household indebtedness has triggered relevant research, available official statistics in several countries do not always capture the significant cross-sectional differences in relation to geographical, age and income criteria. Relevant statistics that measure only age differences in household debt will encourage quantitative research that downplays and possibly misrepresents the effects of other important differences for the explanation of the phenomenon.
- A third problem is that the categories or measurement scales used in available statistics may not be those that would have been most useful from the point of view of the new piece of research. For example, the category systems or scales usually employed to represent ethnicity and social class in available statistics are far from ideal for many research purposes. Also what is involved here is not simply a contrast between data collected by researchers and that generated by organisations with other purposes. Even where data generated in other research projects are being re-used, there will often be a mismatch between how the data were collected and what would have been best for the purposes of the new research.
The significance of the problems we have identified here will vary considerably across different sets of statistics, and (as we have emphasised) will also vary according to how they are going to be used. The key point is that these potential problems must be given attention. Remember that numbers can have a beguiling tendency to lull us into an exaggerated sense of their likely validity or value.
6 Quantitative data analysis, data collection and sampling methods
It is important to distinguish between the various purposes for which quantitative, and indeed any kind of, analysis can be carried out. This concerns the sort of conclusion that is being aimed at; or, to put it the other way around, the kind of question that is being addressed.
Activity 5
Read the following quantitative research study on the history of shareholding and investment in England and Wales, 1870−1930, by Janette Rutterford et al.:
- Rutterford, J, Maltby, J., Green, D. R., and Owens, A. (2009) ‘Researching shareholding and investment in England and Wales: Approaches, sources and methods’, Accounting History, vol. 14, no. 3, pp. 269–292.
The project was funded by the Economic and Social Research Council Grant. The study collects primary data from historical archives in order to investigate investor behaviour in the late nineteenth century and the beginning of twentieth century.
When you become familiar with the study, answer to the following questions:
Question 1
What was the motivation of this study/project?
Add your notes here.
Discussion
Feedback by professor Janette Rutterford:
Yes. The motivation was the investigation of the relationship between gender and investment behaviour during a particular period – 1870 to 1930 – when major changes in investment took place. Investment as a whole boomed at that time with the Limited Liability Acts of the 1850s, the marketing of shares to an increasingly wealthy middle class, the introduction of different new types of security with lower risk to attract risk averse individuals and the increased awareness of investment opportunities with the marketing of bonds and savings certificates to fund World War One. And from the female side, there were a number of changes too. There were the Married Women’s Property Acts of 1870 and 1882, which gave married women rights to hold investments in their own name. And there was also the increasing number of surplus – they were called ‘surplus’ or ‘redundant’ women who needed an investment income to live off, as work was either frowned on or not available and then after World War One was exacerbated by the deaths of men in the war. We wanted to identify changes in investment behaviour by looking at two samples of investment records. First we had a full sample of extant probate records those that were left – assets at death between 1870 and 1902. The remainder of the sample had been destroyed. But testing, we found that the sample that we had was representative of the population in terms both of wealth and of geography across the UK. The second set of investment records, which we’re going to about today, was shareholdings in individual company securities over the period 1870 to 1935.
Question 2
Given the size of the population of UK investors during the time of investigation, the data collection should focus on a representative sample. How would you choose the companies in this sample?
Add your notes here.
Discussion
Feedback by professor Janette Rutterford:
Well, we looked at a number of possible differences and we tried to pick companies, which covered the whole spectrum. So for example for sectors we looked at all possible types of sector and broke them down into agricultural, commercial and breweries, breweries were big in the late nineteenth century. Extractive, which means mining, manufacturing, such as steel mills transport and communications of which railways were the major part. And utilities for example gas companies, which in those days were privately owned.
We also looked at the span of time. We wanted companies which had at least two dates of shareholder records ten years apart so we could get some kind of continuity.
We looked at longevity where the companies succeeded or not so we avoided survivorship bias. So some companies which die, went bankrupt, or taken over, were included and some such as Foreign and Colonial Trust which started in 1868 and lasted throughout the period and is in fact still going.
We looked at different sizes, some small, some large. Some were small and became large. Some were large and became small.
We looked at geography and what we mean by that is where the companies operated they were all registered in England or Wales but they operated in either domestically – so for example companies such as Boots the Chemist. We had Empire operations such as Mahratta, an Indian railway company. And we had companies which operated in foreign countries such as the Cuba Submarine Telegraph. Investors in those days weren’t frightened to invest globally even though the companies were all registered in the UK.
Another difference we looked for was different security types. I’ve mentioned the fact that there were ordinary shares but there were also preference shares and debentures which were lower risk and very attractive to individual investors. So we looked at companies which had different variants of the securities.
And finally we looked at both public companies and private companies. What I mean by that is companies where the securities were quoted on the stock exchange where you could buy and sell them with relatively ease. And we also looked at some private companies where really you could only change hands amongst the shareholders. It was very difficult to sell in the outside world.
Question 3
Could you explain the random sampling of shareholders followed by this research?
Add your notes here.
Discussion
Feedback by professor Janette Rutterford:
Our research differed because we were looking not cross-sectionally but longitudinally over time. So we found that shareholder numbers went from a few dozen to tens of thousands over time. So it went from very small numbers to very large numbers. We were also collecting a lot of information as well as just the name of the shareholder. Address, gender, marital status, details of holdings, company details et cetera, et cetera. So we had a huge amount of data to collect and we clearly couldn’t do one hundred per cent sampling. Systematic sampling, such as sampling one in ten which I said that Kimmell and Parkinson did wouldn’t have worked either, given the changes in numbers of shareholders per company as sampling one in ten in the early years would have told us almost nothing.
The other approach, which we could adopt, was random sampling. You could do this by say numbering shareholders One to whatever number N and then picking random numbers to sample the shareholder records. BUT there were practical reasons against this.
We would have had to count shareholder numbers per register, which would have been time consuming for large registers. Say Barclays at one point had thirty thousand shareholders, and then finding each individual shareholder, in those thirty thousand shareholders would have also have taken time. So we chose a compromise between random and systematic sampling.
The first thing we did was that we estimated the total number of shareholders by calculating the average number of shareholders per page using five pages. We then counted the number of pages and multiplied that by the average per page to get an estimate of the total number of shareholders. We then identified how many shareholders we needed to sample per register to give us a ninety five per cent confidence level, and a seven per cent confidence interval with respect to the population as a whole. We chose these boundaries as they were satisfactory and tighter requirements led to much higher numbers of shareholders needing to be sampled. In practice, this level of confidence meant we had a maximum of two hundred shareholders per register.
We then generated a random number for each letter of the alphabet of the surnames of the shareholders. A minimum of three letters per register were sampled, to avoid just looking at family clusters. So for example if we’d just taken a B and all the owners, the big directors and things had a name beginning with B it would have biased our sample.
With each random letter of the alphabet chosen, a random number start page was determined. And this was quite important because we had shareholder records which came from different sources so some were the formally submitted to the registrar of companies, which is a formal document. Some we were using the actual shareholder registers that the companies were managing. And so what we had is some shareholder records with ‘sticky’. For example, some lists just added new shareholders at the end of the letter so sampling from the beginning of the letter only would have only selected the original shareholders and we wouldn’t have got the new shareholders that came in.
And we would have liked to track the same shareholders over time because we sampled registers every ten years from the 1870s to the 1930s and some company registers were sampled over a period of forty years. But many share records were not in strictly alphabetical order, and numbers rose dramatically in many cases, so we just couldn’t do what is called cluster sampling.
Question 4
Janette Rutterford, professor of Financial Management at the Open University Business School and principal author of this study summarises as follows the main findings:
We learnt a lot about investors in general, not just women. For example how where they lived affected what they bought. So if you had London based shareholders they were very keen on Empire securities such as railways from India. Whereas northerners bought local companies for example steel mills in Sheffield or shipping in Liverpool.
We obviously learnt a lot about women investors because that was the aim of the project and we found that their numbers changed dramatically over the period. Women went from being fifteen per cent of all individual investors in the 1870s to forty five per cent - nearly half – by the 1930s. In terms of value of investments they started in the 1870s with five per cent by value and by the 1930s they were up to thirty five per cent by value. So although perhaps in how much they held wasn’t quite as great as men, the change was really dramatic. And in fact we found that in some shareholder registers women were in the majority, particularly for lower risk securities such as preference shares. So we’re back to these women who were looking for low risk investments for an unearned income. And also they like brand names such as J. Lyons, which had teashops, which they used, or Boots the Chemist, which actually sold shares over the counter at one point.
We are still working on the data in terms of the geography of investment in that I mean how it differed over time, and also we’re looking at how investors diversified their portfolios. Was the increase in the number of shareholdings, which we identified in this research project, due to a larger and larger investor population? Or was it the same small group of investors who simply added more and more shares to their portfolios over time?
Transcript
Listen to the audio, add your own notes and then compare them with the feedback provided.
Discussion
The paper and the interview begin with the general description of the research project and its main motivation. They also refer to the existing previous research on the same issue. This is very important because it differentiates the current study from previous research highlighting its strong points and its real theoretical contribution. Particular emphasis is also given in the sampling method as the main scope of the paper is to identify characteristics of the shareholder population between the 1870s and the 1930s investigating a ‘representative population of industries’ (Rutterford et al., 2009, p. 7). The interview and the paper (in more detail) offer an analytical description of the choice of sectors and related companies in order to achieve a representative sample. They also address issues involved in the sampling process when working with the existing archives. In research projects of this type, the quality of the results hinges upon the structure of the sample. This is the most important part in quantitative research. A general overview of the process can be summarised as follows:
We have here described the methods we used to compile a database of a representative sample of shareholders, covering UK companies from all economic sectors. We have outlined some of the issues and challenges that face historians in identifying appropriate source material and in devising suitable sampling strategies. […] Providing an extensive, sectorally representative sample, and incorporating companies of varying sizes, ages, capital structures and profitability rates, operating in geographical locations within and beyond England and Wales, the data offer a unique opportunity to investigate a neglected aspect of the country’s financial and social history. As well as casting light on the growing significance of investment wealth in the population as a whole, the data set allows us to investigate with confidence the significance of gender in understanding patterns of shareholding and, in turn, how this was shaped by wider, legal, financial and cultural change. The specification of this methodology along with the construction of a major database for capturing historical data on investment […] will also provide a platform for the research to be extended, chronologically and geographically in the future, and a data set that historians of investment in other countries can use as a test against their own findings.
7 Objectivity and bias in research
There has been, and continues to be, a great deal of debate about whether or not research can be objective, and what this means. One interpretation of this term is ‘unbiased’, but the word ‘bias’ is also used in different ways.
The word ‘bias’ is generally used to refer to systematic error in sampling (often referred to as ‘sampling bias’). However, in other contexts, ‘bias’ is restricted to a different source of systematic error: that which could arise from the political or practical commitments, theoretical expectations or assumptions of the researcher. Incidentally, in applying this word, it is important to distinguish between, on the one hand, a researcher having such commitments, expectations and assumptions (and in one respect or another these are probably impossible to avoid, and it may be undesirable to attempt to abandon them) and, on the other hand, those commitments, expectations and assumptions actually causing systematic error in how the research is carried out. The term ‘bias’ ought to be restricted to the latter situation. Moreover, it is not just that having various commitments and expectations does not necessarily bias one’s interpretations of the world, they may actually facilitate the process of reaching sound conclusions. Additionally, even where they threaten to lead us into error, we can take precautions against this, and monitor our judgements to check whether it has happened.
If we define ‘bias’ in this way, it is possible for a researcher to be objective, at least in principle: that term being taken to mean doing research in such a way as to try to minimise bias. Of course, we can never be absolutely sure in practice that no bias has operated. But, even so, it is nevertheless desirable to minimise potential bias. We should note, though, that this is a highly contentious area about which there is much disagreement and debate.
There is an additional problem with the term ‘objectivity’ that should also be highlighted. Sometimes it is interpreted as implying that the account produced by a researcher captures the nature of the ‘objects’ investigated. In other words, this word is treated as synonymous with ‘validity’ or ‘truth’. Also, often, this usage is associated with a particular interpretation of ‘validity’ in which knowledge amounts to a direct representation of how things truly are, for example capturing their essential character. In our view, it is best to avoid using ‘objectivity’ in this second sense.
7.1 Reflections on research biases
There are some senses in which social research is necessarily political, even when it seeks to be non-partisan and to maintain autonomy or independence from politics and practice.
Like many other words, ‘political’ does not have a single standard meaning. It can refer to the struggle to gain power, to issues that involve conflicting values or interests, to matters about which there can be reasonable disagreement (or about which there will be actual disagreement, reasonable and unreasonable), or to issues concerned with the distribution of scarce resources. Which sense of the term is adopted may result in different conclusions about whether or not research is or should be political.
In what respects do you believe that social research is necessarily political or should be political? Think about your reasons for your answer.
In answering the questions below, you will need to think about exactly what the word ‘political’ can mean, and the different respects in which it might be applied to social research.
Activity 6
Question 1
In what respects do you believe that social research is political in relation to the financial resources it requires?
Add your notes here and then compare them with the feedback provided.
Discussion
Social research draws on resources which could have been allocated to other purposes. Gaining and maintaining these resources means that researchers, or their representatives, have to engage in political debate and political action. Thus, there is much politics around research funding bodies, and the relationships between universities and their funding sources (public and private). Social researchers are clearly implicated in these.
Question 2
In what respects do you believe that social research is political in relation to the use of the research findings?
Add your notes here and then compare them with the feedback provided.
Discussion
Research findings may be used in a variety of ways, for diverse purposes, and can have an impact on decisions that are themselves political in one or more of the senses outlined above. It may be argued that this makes research necessarily political as well.
Question 3
In what respects do you believe that social research is political in relation to the goals it serves?
Add your notes here and then compare them with the feedback provided.
Discussion
There is a further sense in which some researchers, and stakeholders, believe that social research ought to be political: that it should be directed towards serving other goals as well as (or instead of) the production of worthwhile knowledge, whether this is supporting the development and implementation of government policy, serving some political organisation, or aiding in the struggle of an oppressed group. There is genuine disagreement among researchers at the present time about whether their work should be political in this sense. It is important to stress that even research which is directed towards no goal other than producing worthwhile knowledge cannot avoid taking other values into account. First of all, judgements need to be made about what is and is not worthwhile knowledge to pursue, in the sense of what questions are worth trying to answer. Secondly, judgements also have to be made about what are and are not legitimate means of pursuing enquiry. This second area is usually discussed under the heading of research ethics.
8 Research ethics
Ethical issues in doing research arise in a variety of ways, and at all stages of the research process. They vary considerably in their seriousness, and in how difficult they are to resolve. Furthermore, how they are interpreted and dealt with is likely to depend upon what the goal of the research is, how valuable and important it is judged to be, and what is being studied. Moreover, as will become clear, divergent views about these matters are to be found among researchers.
Judgements differ about the value of knowledge in itself, and of different kinds of knowledge. Where research is directed towards some practical or political goal, this will guide evaluations of what are legitimate and illegitimate research strategies. Similarly, views about what is and is not justified may vary according to who is being studied. For instance, many of us would take different views about research that focused on national government policymakers, CEOs in financial organisations, trade union leaders, and very young children. What is seen as legitimate in one context may not be judged legitimate in another; though, of course, judgements about these and other cases will differ to some extent according to our political views, and for other reasons as well.
Activity 7
Question 1
Can it ever be justified to observe people covertly (in other words, without their knowing) for the purposes of research?
Add your notes here and then compare them with the feedback provided.
Discussion
Yes, sometimes. This might be legitimate, for example, where the behaviour takes place in a public place. It could also be acceptable under some other conditions, for example where the research topic is important and there is no other way of gaining the knowledge required.
Question 2
Should participants always be told ‘the whole truth and nothing but the truth’?
Add your notes here and then compare them with the feedback provided.
Discussion
What is true and what is the whole truth are often not matters that are easily decided, and there are sometimes good reasons for not telling participants everything that is known about the research project in which they are participating.
Question 3
Are there some matters that are so private or sensitive that they should not be the focus for research?
Add your notes here and then compare them with the feedback provided.
Discussion
There may well be, but often what is more important is how such matters are approached by a researcher. Also, it should not be assumed that we know what will be too private or sensitive from others’ points of view.
Question 4
What types and level of costs, both financial and otherwise, are acceptable for participants in a research project?
Add your notes here and then compare them with the feedback provided.
Discussion
This question is impossible to answer in the abstract, though it would certainly be hard to justify research which has very serious consequences for people’s health or financial circumstances.
Question 5
What, if anything, can participants reasonably expect in return for their participation?
Add your notes here and then compare them with the feedback provided.
Discussion
Again, this is impossible to answer in the abstract. Like many other issues surrounding research ethics, what judgements we make will depend upon the context. Please note that these are only our answers: there is even more disagreement about ethical than about methodological matters.
Conclusion
This free course, Quantitative and qualitative research in finance, offered you the key features of qualitative and quantitative research in finance. It discussed their basic differences. It showed you what these two research approaches can produce and how they could be related to different research projects in finance.
References
Acknowledgements
This free course was written by Dimitris Sotiropoulos.
Except for third party materials and otherwise stated (see terms and conditions), this content is made available under a Creative Commons Attribution-NonCommercial-ShareAlike 4.0 Licence.
The material acknowledged below is Proprietary and used under licence (not subject to Creative Commons Licence). Grateful acknowledgement is made to the following sources for permission to reproduce material in this free course:
Course image: (c) hudiemm/iStockphoto.com
Text:
Activity 2: Green Paper: Towards a Common Understanding of Risk by The True Potential Centre for The Public Understanding of Finance (PUFin) The Business School of The Open University © The Open University
Activity 2: Question 5: White Paper: Towards a Common Understanding of Risk by The True Potential Centre for The Public Understanding of Finance (PUFin) The Business School of The Open University © The Open University
Activity 5: Rutterford, J, Maltby, J., Green, D. R., and Owens, A. (2009) ‘Researching shareholding and investment in England and Wales: Approaches, sources and methods47’, Accounting History, vol. 14, no. 3, pp. 269–292
Images:
Figures 1, 2: Figures 5, 6: derived from BIS Statistics http://www.bis.org/
Figure 3: Graph – OECD statistics - Long term annual interest rates (%): : Taken from http://stats.oecd.org/
Figure 4: Sovereign debt (% GDP)/Fiscal budget (%GDP): Taken from http://epp.eurostat.ec.europa.eu/
Figure 5: Graph – Top income share: Taken from http://topincomes.g-mond.parisschoolofeconomics.eu/
Activity 3: Robert Shiller © Bengt Nyman (Flickr: IMG_7458) CC BY 2.0 http://creativecommons.org/ licenses/ by/ 2.0) via Wikimedia Commons
Every effort has been made to contact copyright owners. If any have been inadvertently overlooked, the publishers will be pleased to make the necessary arrangements at the first opportunity.
Don’t miss out
If reading this text has inspired you to learn more, you may be interested in joining the millions of people who discover our free learning resources and qualifications by visiting The Open University – www.open.edu/ openlearn/ free-courses.