

1.3 Making a change
Reflection often leads to the identifying a change needed in some aspect of what we have been reflecting on, whether it’s our work, our learning habits or our lifestyle. But making that change can then prove more problematic than we think.
In the mid-twentieth century Kurt Lewin, a social psychologist who worked in Germany and America, developed a theory called force-field analysis to think about the way in which changes made in the workplace succeed or fail (Lewin, 1947). It can be applied to any action planning or reflection process.
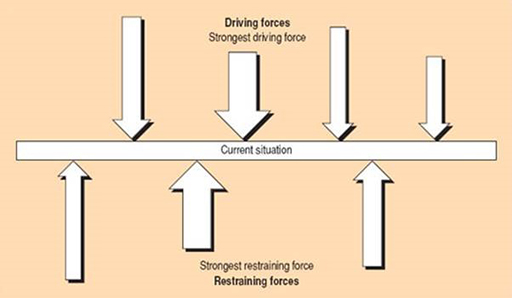
Lewin suggests that any attempt to make changes will involve forces in favour of change and forces against it. For change to occur successfully, the forces in favour must be stronger.
This is something like a tug of war in that if the forces on the left side are stronger than those on the right, then the change can go ahead.
This might not seem much different from the familiar ‘pros and cons’ idea, but pictures often express ideas more clearly than words. A force-field diagram helps you visualise the relative strength of the different forces, as you will see shortly. It lends itself to thinking about how you can weaken the team on the right, or bring in heavyweights to add to the one on the left.
There will almost always be forces in favour and forces against the changes that you are thinking about. Some forces will be quite significant; others might not have much effect. It is useful, once you have thought about what the main factors are, to estimate how much impact they might have on you achieving your target goal.
In a force-field analysis diagram, you can use arrows to represent the different forces, with the thickness of the arrows indicating the amount of impact. The thin arrows indicate fairly minor factors; the fatter ones indicate major influences.