2 Repeated measurements
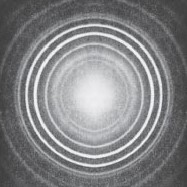
Scientists are always concerned with the reliability and precision of their data, and this is the prime reason for them to repeat measurements many times. Consider the photograph shown in Figure 1, which is the result of X-ray diffraction (see Box 1). To determine the atomic structure of the substance that produced this pattern, it would be necessary to measure the diameters of the fuzzy rings. At one time, this would probably have been done with an instrument called a travelling microscope; nowadays a computer would be involved. But whatever the method, there will always be a difficulty in being sure where to take the measurement within a fuzzy area, so the measurement of diameter of any one ring would need to be repeated a number of times.
Box 1 X-ray diffraction
X-ray diffraction is one of the most widely used techniques for the determination of the geometrical arrangement of atoms in crystalline materials, including those of biological origin and those with high technology credentials such as superconducting ceramics. The X-ray diffraction pattern in Figure 1, which was recorded on a relatively simple instrument, is for zirconium oxide, a substance which because of its extremely high melting point (2700 °C) is used in furnaces.
Generally the process of repeating measurements of a particular quantity would lead to a number of slightly different results being obtained. Measured values of one quantity that are scattered over a limited range like this are said to be subject to ‘random uncertainty’. Measurements for which the random uncertainty is small (i.e. for which the range over which the measurements are scattered is small) are described as precise. The ‘best’ estimate scientists could make of the diameter of each ring in Figure 1 would be some sort of average of all the measured values.
The scatter inevitably associated with raw data begs various questions. For instance,
- how close to the ‘true’ value is this calculated average value?
- how close to the ‘true’ value is one typical measurement likely to be?
- conversely, how probable is it that any given measurement will be close to the average value?
Matters will be further complicated if there is some inherent error or bias in the measuring instrument, such that all the readings are, say, too large by a fixed amount. Such measurements are said to have a ‘systematic uncertainty’. Note that unless measuring instruments can be constantly checked against one another, it is easy for quite large systematic uncertainties to creep unnoticed into measurements. Measurements for which the systematic uncertainty is small are described as accurate. Of course to get anywhere near to the ‘true’ value of a quantity, measurements have to be both accurate and precise!

