

1.1 Different types of distribution
Figure 2 showed that if the data have a normal distribution the mean value corresponds to the peak of the distribution. Normal distributions of data are very common in science, but are by no means universal. Figure 4 shows some other possible distributions, three of which are symmetric and one of which is skewed (i.e. not symmetric).
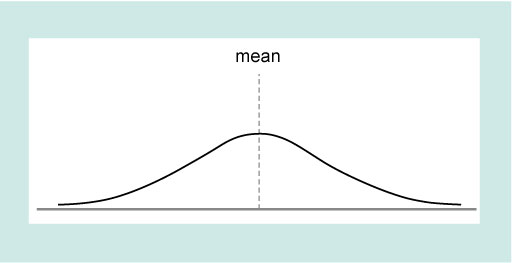
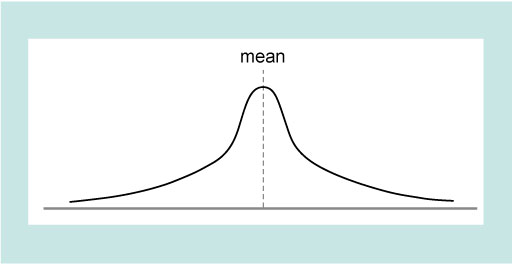
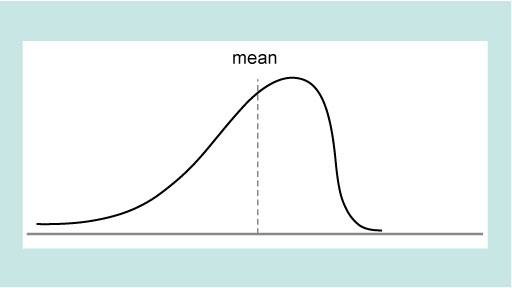
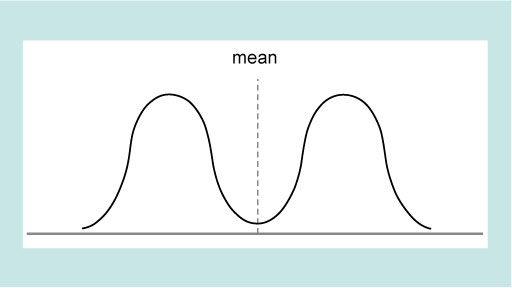
As you will see in the next section these different types of distribution leads to consideration of what type of average best represents the data.