

2 Different types of ‘average’
In many cases, especially if the distribution is skewed, the mean is not the best way of representing an average or typical value. Imagine for example a small company with a single owner who pays himself £900,000 a year and 10 employees who are each paid £10,000. The statement that the mean annual income of these 11 workers is more than £90,000 (i.e. £1000,000 divided by 11) – although true – is somewhat misleading! In such cases, two other quantities, the mode and the median, may represent the data more fairly.
The mode is the most frequently occurring value in the set of data. If the data are plotted on a histogram or a bar chart, the mode will be the value corresponding to the tallest bar.
Activity 1 Mode of small company earnings
What is the mode of the earnings in the company described above?
Answer
The mode is £10,000. This is certainly more representative of the typical earnings than the mean would be!
Note that in some cases there may be more than one value for the mode; for example, that would be the case for the distribution shown in Figure 4, as there are two distinct equal size peaks.
The median is the middle value in a series when the values are arranged in order of size. 'This means that there are as many values bigger than the median as are smaller than the median. If there are an odd number of measurements, the median is the middle measurement; if there are an even number of measurements it is the mean of the middle two values.
To see how this works try this activity now.
Activity 2 Flowers: finding the mode
Ten plants of a particular species were chosen at random and the number of flowers on each plant were counted. The results were:
8; 7; 4; 8; 10; 7; 9; 7; 8; 7;
What is the mode for these data?
Answer
The best way of answering this is to compile a table showing the number of plants with particular numbers of flowers:
| number of flowers | 4 | 7 | 8 | 9 | 10 |
| number of plants | 1 | 4 | 3 | 1 | 1 |
The mode is 7 flowers as there are more plants with 7 flowers than with any other number of flowers.
- What is the median for these data?
Answer
To answer this, you have to order the data. In increasing numbers of flowers, the results obtained were:
4; 7; 7; 7; 7; 8; 8; 8; 9; 10.
With a sample of 10 plants, an even number, the median is the mean number of flowers on the 5th and 6th plants (counted in either ascending or descending order). In ascending order, the 5th plant has 7 flowers and the 6th has 8, so the median is .
Box 1 illustrates a case in which the mode and median give a more representative summary of the data than the mean.
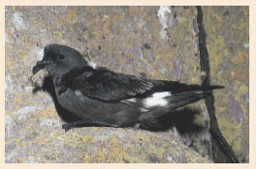
Box 1 Seabird migration
In a study of Storm Petrels (small seabirds), several thousand birds were marked with identifying rings when they were at their nests on a Shetland island. After nesting, the birds dispersed. Twenty-eight of the birds were subsequently reported as having been recovered in other areas, as shown in Table 1.
Taking all 28 observations into account, the mean distance from their nest site at which the birds have been recovered is 554.5 km. However, this is not a very useful way in which to summarize the data, because in fact 13 out of the 28 birds (i.e. nearly half) moved less than 100 km, and only two moved further than the mean distance.
| Recovery place | Distance from nest site/km | Number of birds recovered |
| Shetland (Lerwick) | 49 | 8 |
| Shetland (Foula) | 77 | 5 |
| Fair Isle | 114 | 5 |
| Orkney | 157 | 2 |
| Sule Skerry | 248 | 3 |
| Summer Isles | 382 | 1 |
| St Kilda | 529 | 2 |
| Cape Clear | 1114 | 1 |
| South Africa (Durban) | 10568 | 1 |
The median distance is 114 km and this is a more typical value.
This example shows how the mean can be highly dependent on a small number of measurements that are a long way from the mode. In this case, the single recovery from South Africa has an enormous influence on the mean. But the median is ‘resistant’ to extreme values. Even if the bird recovered in South Africa had stopped in Morocco, or alternatively if it had gone to New Zealand, the median value would have remained 114 km.
In Week 7 you learned that loosely sets of data may be classified into two different types, ‘repeated measurement’ and sampling. Week 7 looked at descriptive statistics for repeated measurements, and in the next section you will turn your attention to sampling.