
2 Why you need to drink
Your body cannot manufacture enough of its own fluid. On average, your body loses 2.5 litres of water daily, but this can vary according to the environment and physical activity levels. On average, water is lost in sweat (0.45 litres), breathing (0.35 litres), faeces (0.2 litres) and urine (1.5 litres), so, you can see that most fluid is lost in urine. The kidneys are involved in maintaining body fluid homeostasis and the balance of electrolytes (sodium, bicarbonate, potassium and chloride).
This fluid needs to be replaced by drinking and what is available in the food you eat. The latter accounts for about 20–30% depending on how ‘sloppy’ your food is! Soups, fruit and vegetables can be more than 80% fluid; 40–70% in hot meals. It is said that eating food stimulates drinking and studies have shown that 75% of fluid intake is while eating, which also facilitates chewing and swallowing.
Your body controls its water volume tightly and under normal circumstances, it fluctuates less than1% daily. The brain detects changes in the concentration of electrolytes in the blood, and releases hormones to either conserve or excrete water.
- How much would this be for you?
- What is your weight and what is 1% of that weight?
These subtle changes allow the body to maintain homeostasis. Hormones are used to either excrete more urine or concentrate urine when more fluid is needed in the body. The level of hydration changes throughout the day, but the body can regulate itself over a 24-hour period. This is why your urine can be different colours during the day. Don’t flush before you have had a peek to see what colour yours is.
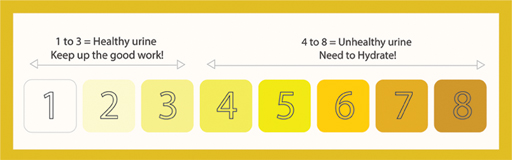
A urine colour chart can be useful (Figure 2). Dr Lawrence Armstrong published the first validated urine colour chart in 1994. There are eight colour scales, 1–3 being normal. The darker the urine, the more concentrated it is. A pale straw colour is what you would expect for normal hydration.
Activity 2 Check your hydration status
To check your hydration status, you could collect your urine in a clear cup and compare it against the urine colour chart. Have a look at different times of the day: for example, first thing, during the day and last thing at night.
Please note: certain foods you eat may colour your urine (for example, beetroot or asparagus). You may also find this happens with certain medications. Always check the medicine leaflet, so you are not alarmed when you check your urine.