
3 Using the quiz
It is often thought that the process of taking the test is more important than looking at the results. With this in mind, exams and test conditions have been strongly controlled and monitored. Ensuring that students can’t find the answers during a test or copy from each other takes up teacher’s time and energy. Also making sure that those who are completing tests at a distance aren’t cheating, has been a massive barrier to distance learning. Plagiarism checking has taken up a huge amount of time and resource in higher education. However formative assessment (which is used purely to help students to improve) has tried to focus on the learning that can be achieved through completing tests. When a student is looking up an answer they are motivated to learn the answer – as long as this requires some thought rather than simply repeating an answer. Again this comes back to carefully constructing the quiz questions rather than controlling the test conditions.
How you present the results from a quiz can make a major difference to how they are understood by the students and by a teacher. Even presented with a breakdown of which questions they answered correctly and which ones were wrong, it can still be difficult to pinpoint the precise gaps in understanding.
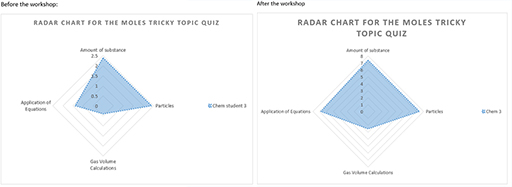
If a student received a 17 out of 20 score, which is the standard way to receive results, they simply get feedback that they are doing quite well or if they get 5 out of 20 that they are doing quite badly. Listing the questions or the topics that they got right as red or black can start to give them a bit more information on where the gaps in their understanding are. However, presenting results from a quiz in a spider or radar chart, with the stumbling blocks represented on each axis, is a powerful way to represent depth of understanding since the multiple scores on one stumbling block show that area as larger. This would mean that the student who received 5 out of 20 had either increased their understanding across the board a little or that they had actually totally understood one stumbling block out of the 4 or more in a tricky topic. Both the listing of the colour coded answers and radar charts can help the student and teachers to understand how a student is progressing more accurately. Emotionally this can also be rewarding to help understand where their gaps in understanding are. In contrast the student who received 17 out of 20 may have thought they were doing well but it could be that they were only doing very well in 3 of the 4 stumbling blocks. See Figure 4, for example, which shows the results for one student in a chemistry quiz. The student has improved their score slightly on two stumbling blocks but there is still some lack of understanding on the ‘gas volume’. It could be that the student who only got 5 out of 20 actually is doing very much better on that one stumbling block than the student who got 17 out of 20. For a teacher this could help with matching up students for peer learning.
Within the tricky topic process, the quiz visualisation feedback was initially envisaged as a mechanism to support students interpreting their depth of understanding for the tricky topic and related stumbling blocks. However, it has been found that teachers’ usage of the data from quizzes can be far more nuanced if they have class-wide visualisation. Teachers have noted impacts on their future teaching practices, as well as the students own directed learning activities based upon the quiz visualisation.
Figure 5 shows results for the chemistry class of eight students. Each shade represents the results for a student. The teacher deconstructed the visualised results and identified different ways to pair learners for peer learning activities.
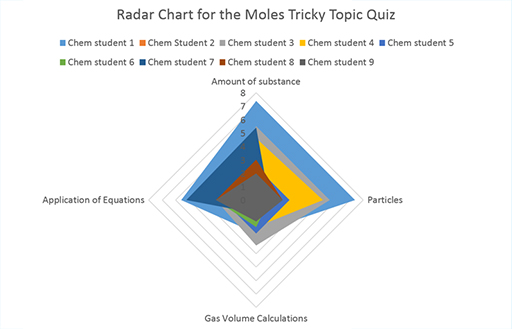
It makes me think that students can peer teach and try and unpack their learning. This makes me think the intervention could be with them.
Upon further reviewing of the visualisation, the same teacher identified that there was also a more generic issue of understanding across all the students on the ‘gas volume’ stumbling block, which had been answered correctly by only two students. The teacher explained:
But this [gas volume calculations] has to be a bit more about my teaching. I've then got to go look at it again and go, what is it about that that doesn’t work? ... it could be me?... possibly re-teaching it again could be useful.