
2.2 National hydro resources
Data for the 11 countries whose hydro output in 2015 was greater than 50 TWh, together with a few other European countries of interest is shown in Table 2. Several countries appear to have developed more than half their technical potential already; but some may limit their estimates of ‘technical potential’ to sites that have been studied in detail.
| Country | Technical potential/TWh y-1 | Installed capacity/GW | Annual output/TWh y-1 | Average capacity factor | Percentage of nation’s electricity |
| China | 2500 | 171 | 616 | 41% | 17% |
| Canada | 830 | 73 | 399 | 62% | 64% |
| Brazil | 1250 | 78 | 391 | 58% | 84% |
| USA | 1340 | 77 | 275 | 41% | 7% |
| Russia | 1670 | 50 | 176 | 40% | 18% |
| Norway | 240 | 30 | 127 | 49% | 96% |
| India | 660 | 38 | 106 | 32% | 12% |
| Venezuela | 260 | 15 | 86 | 67% | 69% |
| Japan | 136 | 28 | 74 | 30% | 7% |
| Sweden | 130 | 16 | 76 | 54% | 49% |
| France | 100 | 21 | 58 | 32% | 11% |
| Austria | 75 | 8 | 37 | 50% | 53% |
| Italy | 65 | 18 | 46 | 28% | 16% |
| Switzerland | 43 | 14 | 36 | 31% | 52% |
The countries with the highest capacity factors tend to be those where hydropower makes a significant contribution but is not the only major source of electricity – a situation that allows the relatively cheap hydropower to be used to its full potential, with an alternative source of electricity available when hydropower cannot meet demand.
In general, if almost all a nation’s electricity comes from hydro plants, annual capacity factors are usually lower, because the installed capacity must be large enough to meet the maximum demand experienced during any day (or year).
Compared with the countries in Table 5.2, the hydro resource of the UK is small. The installed capacity in 2016 was about 1.8 GW including a little over 350 MW small-scale hydro, (BEIS, 2017) with output varying in recent years between about 4.7 and 6.3 TWh – reflecting year-on-year weather variations throughout this relatively small area. However the capacity of and production from small scale hydroelectric plants has shown as significant increase in recent years from 216 MW in 2012 to over 350 MW in 2016 (BEIS, 2017).
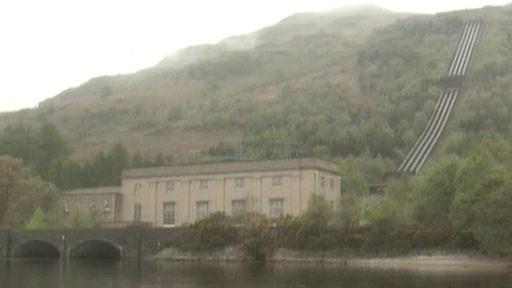
Watch this short video, which describes the 152.5MW Loch Sloy hydroelectric power station and gives a brief view of small-scale hydro installation.
Next you’ll look at hydro output on a world scale.