

4.2 Averages
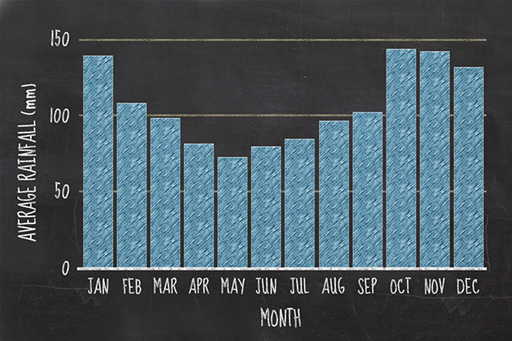
Many numbers presented in the media are averages, commonly used in statements like ‘the average temperature rise due to climate change since 1860 was 0.8 °C’, or ‘rainfall was 40% above average for June’. But what does ‘average rainfall’, or ‘average temperature’, actually mean?
The word ‘average’ is often used to mean ‘ordinary’, ‘typical’ or ‘normal’. This is fine in everyday contexts, but, in scientific contexts, average also has a mathematical meaning. It is used to report the typical value within a set of data, sometimes with an associated range indicating the spread of the data. This makes averages useful when presenting data because, instead of describing each value in the dataset, you can present just one value which approximates your whole set.