
3 Measuring biodiversity
This section looks at how to assess and rank biodiversity.
Activity 3 Woodland comparisons
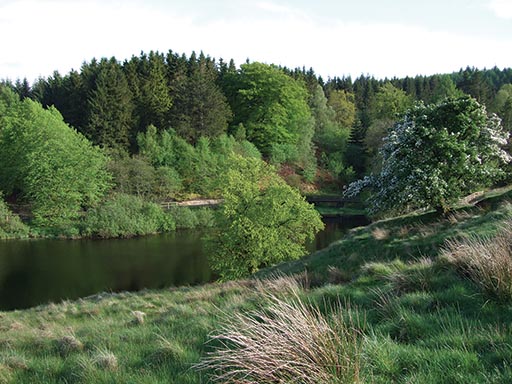
Look at the three different woodlands in Figures 5–8 and rank them in order of increasing species diversity.
Answer
You might rate the Daintree rain forest in Australia as being the one with greatest diversity because it is tropical. You might then rank the Canadian pine forest as being the least diverse as it is in a cold climate. The European wood, which was also featured in the video in this week’s Introduction, would then come in the middle.
Activity 4 Woodland comparison and numerical comparison
It is relatively easy to make a judgement about biodiversity, as you were asked to do in Activity 3, but is such a judgement accurate? Consider how you could quantify diversity and thus have a numerical comparison.
Answer
The diversity of species within an ecosystem is made up of two components. The obvious one is simply the number of different species that are present. However, the number of organisms of each species is also important. So the two components are:
species richness
relative abundance
and each can be assigned a numerical value.
Consider two of the woodlands shown at the start of this section – the mixed woodland and the pine forest. Suppose you counted the number of species of tree present and found that there were equal numbers of species in each woodland. Would that mean the two types had the same species diversity? Think about this question before moving on.
The fact that the two woodlands had the same number of tree species would not necessarily mean they had the same species diversity, because the number of individuals of each species might be different. A pine forest might be dominated by only one or two species with the other species being present in very small numbers. By contrast, the mixed woodland (Figure 9) might have roughly equal numbers of each species of tree. Each of these woodlands would have the same number for species richness but very different figures for the relative abundance of each species.
Imagine two woods. Wood 1 has 5 species of tree of equal abundance, so the relative abundance for each species would be 20%. Wood 2 also has 5 species of tree but one is dominant; the relative abundance here might be 90% for the dominant species and 2.5% for each of the other four species.
It is possible to combine the relative abundances for the species in each wood to obtain an index of species diversity. A number of methods for achieving this have been devised – for example, the Shannon index and the Simpson index. As long as the same index is used for each wood, a direct comparison of species diversity is possible, and there are equations for the calculation of the index of species diversity. All you need to know at this stage, however, is that an index can in fact be calculated. The explanation below is for interest only. (Note also that this woodland example relates only to diversity of trees, but there are likely to be plenty of other species of plants and animals present even if the trees are all of the same species.)
The Shannon index, H, is calculated by adding together terms for the relative abundance of each species in the area being surveyed. The term for relative abundance is calculated from the percentage of abundance, as a proportion, multiplied by the natural log of the percentage. In Wood 2, the index would be:
H = -[(0.90 x ln0.90) + 4(0.025 x ln0.025) = -(-0.095) + 4(-0.092) = -(-0.095) + (-0.368) = 0.463.
For Wood 1, the index would be 1.609. So, the larger the index, the greater the diversity.
Now imagine what you would need to do to get the information required to calculate species diversity in woods and forests. You would need to identify and list all of the species present within a sample area and, for each, an estimate of the number of individuals present. This is not a small task, and you can probably see a role for citizen scientists in such surveys.