

7.2 Customising your view of iSpot – community filters
To see a map of iSpot observations, click on the ‘Explore community’ button on the taskbar at the top of the home page and select ‘Observations > Map’ from the drop-down menu. This will take you to a page showing the latest 1,000 observations from the iSpot community to which you are linked. If you want to see more than 2,000 observations on the map, click on ‘Show more observations’, but note that, the more observations you add to your map, the longer it will take to load. If you are interested in only a particular geographic area, zoom into that area first before you start adding records to the map.
You can also filter the observations shown on this page to see only those of interest to you. Click on ‘Filter community observations’ and you will see a window that allows you to choose a range of options (Figure 19): There are filters for:
- species groups (filter by group)
- species names (filter by taxonomy)
- date (observed or submitted)
- whether or not the observations have a likely ID (e.g. you can choose to look at observations without a likely ID to see if you can help to identify them).
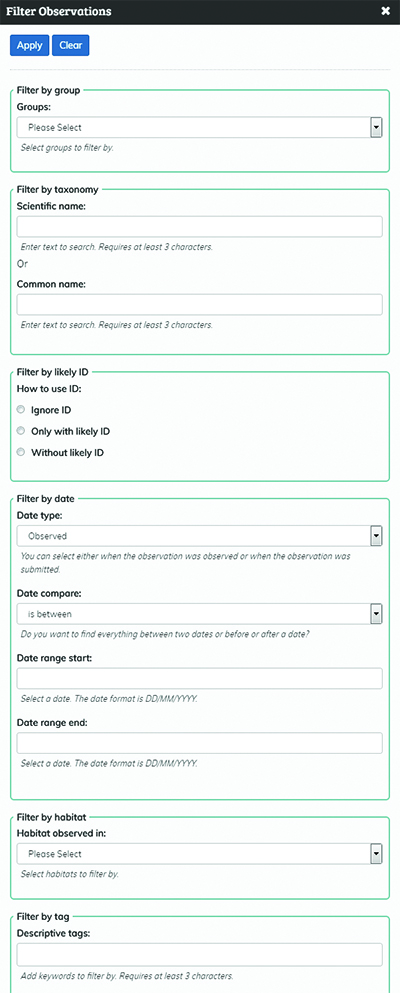
Note: you can add as many filters as you wish. Simply click on ‘Apply filter’ to see the resulting map from the options selected.