

1.1 Splitting a dataset by grouping
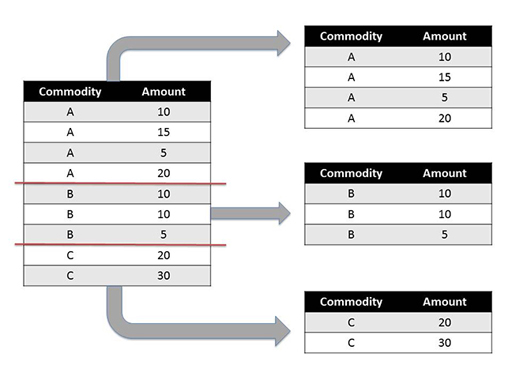
‘Grouping’ refers to the process of splitting a dataset into sets of rows, or ‘groups’, on the basis of one or more criteria associated with each data row.
Grouping is often used to split a dataset into one or more distinct groups. Each row in the dataset being grouped around can be assigned to one, and only one, of the derived groups. The rows associated with a particular group may be accessed by reference to the group or the same processing or reporting operation may be applied to the rows contained in each group on a group by group basis.
The rows do not have to be ‘grouped’ together in the original dataset – they could appear in any order in the original dataset (for example, a commodity A row, followed by a two commodity B rows, then another commodity A row, and so on). However, the order in which each row appears in the original dataset will typically be reflected by the order in which the rows appear in each subgroup.
Let’s see how to do that in pandas. Create a simple dataframe that looks like the full table in the image above:
In []:
data=[['A',10],['A',15],['A',5],['A',20],
['B',10],['B',10],['B',5],
['C',20],['C',30]]
df=DataFrame(data=data, columns=["Commodity","Amount"])
df
Out[]:
| Commodity | Amount | |
|---|---|---|
| 0 | A | 10 |
| 1 | A | 15 |
| 2 | A | 5 |
| 3 | A | 20 |
| 4 | B | 10 |
| 5 | B | 10 |
| 6 | B | 5 |
| 7 | C | 20 |
| 8 | C | 30 |
Next, use the groupby() method to group the dataframe into separate groups of rows based on the values contained within one or more specified ‘key’ columns. For example, group the rows according to what sort of commodity each row corresponds to as specified by the value taken in the ‘Commodity’ column.
In []:
grouped = df.groupby('Commodity')
The number and ‘names’ of the groups that are identified correspond to the unique values that can be found within the column or columns (which will be referred to as the ‘key columns’) used to identify the groups.
You can see what groups are available with the following method call:
In []:
grouped.groups.keys()
Out []:
['A', 'C', 'B']
The get_group() method can be used to grab just the rows associated with a particular group.
In []:
grouped.get_group('B')
Out []:
| Commodity | Amount | |
|---|---|---|
| 4 | B | 10 |
| 5 | B | 10 |
| 6 | B | 5 |
Datasets can also be grouped against multiple columns. For example, if there was an extra ‘Year’ column in the above table, you could group against just the commodity, exactly as above, to provide access to rows by commodity; just the year, setting grouped = df.groupby( 'Year' ); or by both commodity and year, passing in the two grouping key columns as a list:
grouped = df.groupby( ['Commodity','Year'])
The list of keys associated with the groups might then look like [(‘A’, 2015), (‘A’, 2014), (‘B’, 2015), (‘B’, 2014)]. The rows associated with the group corresponding to commodity A in 2014 could then be retrieved using the command:
grouped.get_group( ('A',2014) )
This may seem to you like a roundabout way of filtering the dataframe as you did in Week 2; but you’ll see that the ability to automatically group rows sets up the possibility of then processing those rows as separate ‘mini-dataframes’ and then combining the results back together.
Exercise 2 Grouping data
Work through Exercise 2 in the Week 4 notebook.
As you complete the tasks, think about these questions:
- For your particular dataset, how did you group the data and what questions did you ask of it? Which countries were the major partners of your reporter country for the different groupings?
- With the ability to group data so easily, what other sorts of questions would you like to be able to ask?