

1.3 Summary operations
Summary, or aggregation, operations are used to produce a single summary value or statistic, such as the group average, for each separate group.
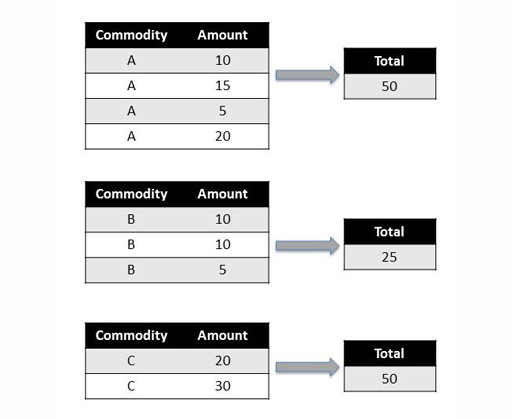
Find the ‘total’ amount within each group using a summary operation:
To apply a summary operator to each group, such as a function to find the mean value of each group, and then automatically combine the results into a single output dataframe, pass the name of the function in to the aggregate() method. Note that pandas will try to use this operator to summarise each column in the grouped rows separately if there is more than one column that can be summarised. So for example, if there was a ‘Volume’ column, it would also return total volumes.
Let’s use again the example dataframe defined earlier:
In []:
df
Out[]:
| Commodity | Amount | |
|---|---|---|
| 0 | A | 10 |
| 1 | A | 15 |
| 2 | A | 5 |
| 3 | A | 20 |
| 4 | B | 10 |
| 5 | B | 10 |
| 6 | B | 5 |
| 7 | C | 20 |
| 8 | C | 30 |
Group the data by commodity type and then apply the sum operation and combine the results in an output dataframe. The grouping elements are used to create index values in the output dataframe.
In []:
grouped=df.groupby('Commodity')
grouped.aggregate(sum)
Out[]:
| Amount | |
|---|---|
| Commodity | |
| A | 50 |
| B | 25 |
| C | 50 |
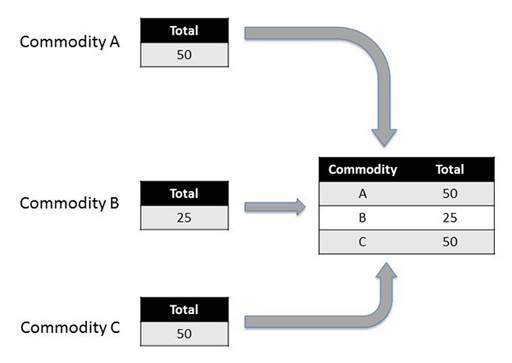
In this case, the aggregate() method applies the sum summary operation to each group and then automatically combines the results. For a summary operation such as this, the resulting combined dataframe contains as many rows as there were groups created by the splitting .groupby() operation.
The slightly more general apply() method can also be substituted for the aggregate() method and will similarly take the rows associated with each group, apply a function to them, and return a combined result.
The apply() method can be really handy if you have defined a function of your own that you want to apply to just the rows associated with each group. Simply pass the name of the function to the apply() method and it will then call your function, once per group, on the sets of rows associated with each group.
For example, find the top two items by ‘Amount’ in each group:
In []:
def top2byAmount(g):
return g.sort_values('Amount', ascending=False).head(2)
grouped.apply(top2byAmount)
Out[]:
| Amount | ||
|---|---|---|
| Commodity | ||
| A | 3 | 20 |
| 1 | 15 | |
| B | 4 | 10 |
| 5 | 10 | |
| C | 8 | 30 |
| 7 | 20 |
The second index column containing the numbers 3, 1, 4 etc., contains the original index value of each row.
In Week 3 the apply() method was called on a column, to apply the given function to each cell. Here it was called on a grouped dataframe, to apply the given function to each group.
Exercise 3 Experimenting with split-apply-combine
Work through Exercise 3 in your Exercise notebook 4 to practise the summary operations.
As you complete the tasks, think about these questions:
- For your dataset, which months saw the highest and lowest levels of trade activity? Did there appear to be any seasonal behaviour?
- When graphically comparing total trade flows from the leading partner countries to the World total, did it look as if any partners particularly dominated that area of trade? If you have time, find news reports discussing why this should be the case.