Skip to content
Skip to main content

About this free course

Download this course

Share this free course

Teaching mathematics

Start this free course now. Just create an account and sign in. Enrol and complete the course for a free statement of participation or digital badge if available.

Pictograms

Pictograms use images to represent data (Figure 17). A key is needed in order for a pictogram to make sense.

A pictogram showing cupcake sales.
Figure 17 A pictogram of cupcakes sold

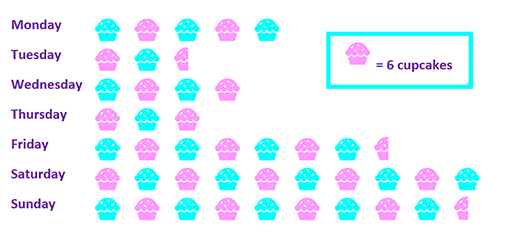
Since one cupcake image represents 6 cupcakes sold, you can see that 30 cupcakes (5 × 6) were sold on Monday and 15 cupcakes (2½ × 6) were sold on Tuesday.