
4.3 Chemical fingerprints in starlight
You have learned that wavelength determines the colour of light. You have also learned that light from a moving object has its wavelength stretched or compressed by the Doppler effect. So, you might think you could know that a star is moving because its colour changes. In fact, it isn’t quite so easy. The changes in the colour of the starlight, caused by the star’s wobble, are extremely slight and they are not something that your eyes would be able to detect. Detection requires the use of a technique called spectroscopy, which spreads the light out into a stretched-out rainbow of very gradually changing colours called a spectrum. Using this technique, a specific property of starlight can be used to enable the measurement of the tiny colour changes.
In Week 1, you learned that stars are big balls of hydrogen and helium gas. But stars also contain very small amounts of other chemicals in gaseous form. These include other gases such as oxygen, as well as substances that you are used to seeing as solids on Earth – for example metals such as iron and calcium. All of these other gases are present throughout the star, including in its outer layers. The outer layers of a star are where the starlight you see originates – the gases here leave their signatures in the starlight. This is extremely useful to astronomers, who can gather lots of information from it.
What are these signatures? Every chemical has a special fingerprint of its own that is visible when light shines through it. Each chemical absorbs very specific colours of light. Their signatures are all different, which is something you will learn more about in later weeks of this course. For now, it’s enough to know that astronomers have very precise knowledge of the colours or wavelengths of light that each gas absorbs.
Astronomers spread out the light they collect into its different wavelengths, and measure exactly how much light a particular star emits at each precise wavelength. A graph showing the amount of light at each wavelength is also called a spectrum (plural: spectra). If a particular gas is present in the outer layers of the star, it will produce a distinctive pattern in the spectrum. The pattern is the same whether the gas is in a laboratory on Earth, in the outer layers of the Sun, or in a distant galaxy. This simple and beautiful fact is the foundation of most of what we know about the Universe.
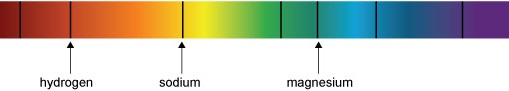
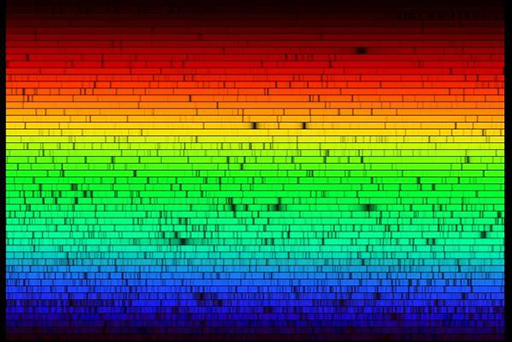
Figure 7a shows some of the precise wavelengths or colours of light absorbed by different gases in the Sun’s outer layers. For example, the dark line in the red part of the spectrum is there because hydrogen gas absorbs that colour of light. The yellowy-orange that is absorbed by sodium is the same colour you see in sodium street lights. We call these dark lines in the spectrum absorption lines. Figure 7b shows how incredibly detailed the real spectrum of the Sun is.
Helium is named after the Sun (‘Helios’ is Greek for ‘Sun’). The reason for this is that helium was detected by astronomers using the spectrum of the Sun before anyone had discovered it on Earth. The chemical fingerprints in starlight can be extremely informative.