
Bar charts
Bar charts are used to represent categorical data, such as favourite colours, and discrete numerical data, such as the number of children in a group of families.
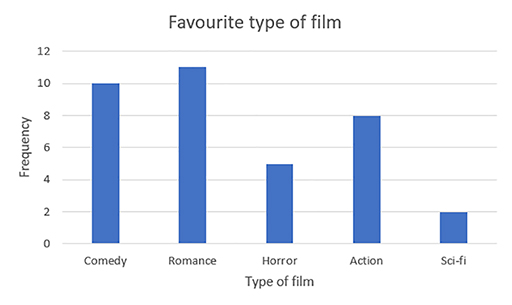
In a bar chart the height of each bar represents the frequency corresponding to each category (Figure 18).
Activity _unit9.3.1 Activity 12 Reading data from a bar chart
Timing: Allow 5 minutes
- How many people prefer sci-fi films?
- How many people like comedy and romance films?
- How many people were asked in this survey?
Discussion
- Two people prefer sci-fi films.
- There are 21 (10 + 11) people who like comedy and romance films.
- A total of 36 people were asked (the sum of the frequencies).