

4.5 Making signals from combinations of sine waves
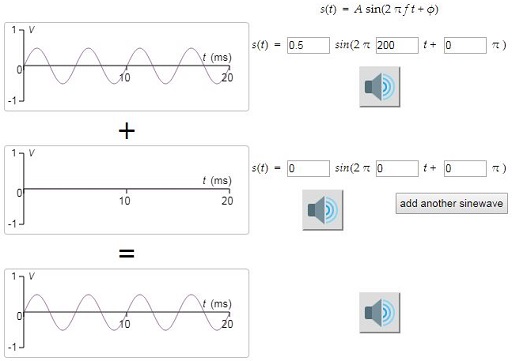
Right-click on the image below to open Interactive 3 in a new tab, then change the values for the top two waves so that the frequency of the first is 440 Hz and the frequency of the second is 660 Hz. Make the amplitude of both 0.5.
The wave at the bottom is formed by combining these two waves, by adding their values for each value of t.
Click on the loudspeaker button for each of the top two waves and listen to the resulting sounds. Then click on the loudspeaker button for the bottom wave and listen to its sound.
SAQ 8
- a.Is the composite signal at the bottom a sine wave?
- b.What is the ratio of the frequencies of the sine waves at the top?
- c.Does the combined signal sound pleasant with the single sine waves in harmony?
- d.Do you think there is any relationship between the ratio of the frequencies and the notes harmonising?
Answer
- a.No, the combined signal is not a sine wave. It has a more complicated shape.
- b.The ratio of the frequencies is 440:660 or 2:3.
- c.This is a subjective question, but you may agree that it sounds as if the individual waves do combine to make a harmonised sound.
- d.Generally, in music, notes with frequencies in simple proportions harmonise with each other.
SAQ 9
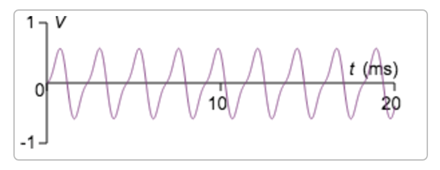
Keep the frequency of the first wave at 440 Hz and its amplitude at 0.5. Change the frequency of the second wave to 880 Hz and change its amplitude to −0.17 (don’t overlook the minus). What is the shape of the resulting wave?
Keep the interactive open, because you will need it in the next section.