
3.3 A breeding experiment: stage two
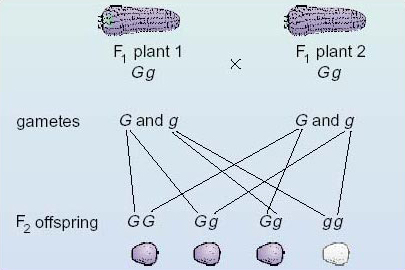
We now turn to the second stage of the breeding experiment, but this time we will follow the phenotypes and genotypes simultaneously. The purple (Gg) grains of the F1 generation are planted and when these have developed into mature F1 plants they produce male and female flowers. These F1 plants are crossed with each other, as shown in Figure 8. The fertilised ovules develop into grains borne on cobs, and these grains are the beginning of the second filial generation (F2).
The mating diagram and the outcome of the fertilisations of this cross are given in Figure 8. First consider the gametes produced by the F1 generation.
Question 8
What are the genotypes of the gametes produced by the F1 purple-grained plants?
Answer
The gametes are either G or g, since all F1 plants are Gg.
Question 9
In what ratio would these two genotypes be produced, and why?
Answer
The ratio would be 1 G: 1 g because the pair of homologous chromosomes on which they are located separate into different gametes in equal proportions.
Now consider the possible fertilisations between the gametes produced by the F1 generation, as shown in Figure 8, and the genotypes and phenotypes of the F2 generation that arises from these fertilisations.
Looking at Figure 8, you can see that the allele G of plant 1 might combine with either the G or the g allele of plant 2 at fertilisation. Over a large number of fertilisations a G-bearing ovule of plant 1 would combine with a G-bearing pollen grain of plant 2 in half of the fertilisations and combine with a g-bearing pollen grain of plant 2 in the other half. Similarly, the allele g of plant 1 might combine with either the G or g allele of plant 2. Hence, in the F2 generation three different genotypes are produced: GG, Gg and gg.
Question 10
What is the expected ratio of the three genotypes in the F2 generation? )
Answer
The expected ratio is 1GG:2Gg: 1gg (see Figure 8).
This ratio follows for two reasons. First, the two different gametes, G and g, are produced in equal numbers. Second, which ovule is fertilised by which pollen grain occurs at random; that is, a G ovule is equally likely to be fertilised by either a G pollen grain or g pollen grain.
The phenotype of each of these genotypes in the F2 generation can be determined since we know that the allele G (purple grain) is dominant to g.
Question 11
What are the phenotypes corresponding to each of the genotypes, GG, Gg and gg of the F2 generation?
Answer
G G and Gg plants are purple-grained and gg plants are white-grained.
Question 12
In what ratio would grains with the purple phenotype and grains with the white phenotype be expected to occur in the F2 generation?
Answer
The expected ratio is three purple (the dominant phenotype): one white (the recessive phenotype), since three of the four possible fertilizations have at least one dominant G allele (see Figure 8).
The phenotypic ratio of 3 : 1 (three of the dominant phenotype: one of the recessive phenotype) and the genotypic ratio of 1 : 2 : 1 (one homozygous dominant: two heterozygous : one homozygous recessive) are of fundamental importance in genetics.
Figure 9 presents the same information about the breeding experiment as shown in Figure 8, but the information is laid out in a different way. Either way of presenting the details of a cross can be used, and when producing your own diagrams you can use whichever is easier for you (although you are not expected to draw the phenotypes).
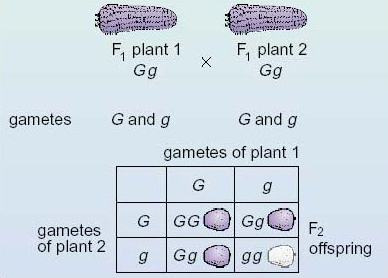
In Figure 9 the fertilisations between the various combinations of gametes from the F1 generation are shown in boxes at the bottom. Along the top you can see the two types of gamete produced by plant 1 of the F1 generation; down the left-hand side you can see the two types of gamete produced by plant 2 of the F1 generation. Inside the other boxes are the genotypes of the products of fertilisation between the various kinds of gamete, that is, the F2 generation. Thus, for example, the top left-hand box records the outcome of fertilisation between a G ovule and a G pollen grain. An examination of the contents of the four boxes should convince you that the expected ratio of genotypes of the F2 generation is 1 GG:2Gg: 1 gg (one homozygous dominant: two heterozygous : one homozygous recessive) and that the expected phenotypic ratio is therefore three purple : one white (three of the dominant phenotype : one of the recessive phenotype).
This breeding experiment in maize, which we just have described, is similar in essence to a famous series of experiments carried out by Gregor Mendel (Figure 10) on the garden pea, Pisum sativum. Mendel introduced the scientific approach to breeding experiments by:
-
following a single pair of contrasting characters in each investigation;
-
breeding beyond one generation;
-
counting the individuals showing each of the phenotypes;
-
working with large numbers of offspring.
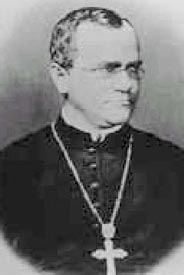
Although the existence of genes and chromosomes was not known in Mendel's time, he predicted the separation or segregation of units (now called genes and alleles) during gamete formation. We now know that meiosis ensures that each gamete contains only one copy of a gene, because the pairs of chromosomes on which the genes are located separate into different gametes (Figure 7). This segregation of genes (units) has been given formal recognition as Mendel's law of segregation.
The breeding experiment in maize shows that characters due to dominant or recessive alleles, such as grain colour, show a particular pattern of inheritance from generation to generation: the F1 offspring all resemble one of the parents (Figure 7), and the F2 offspring have the phenotypic ratio of 3 :1 and the genotypic ratio of 1: 2 :1 (Figures 8 and 9). The action of dominant alleles explains why the recessive character 'disappears' in the F1 generation and why this character reappears in the F2 generation. Most importantly, this pattern of inheritance is a consequence of two events.
-
The two copies of a gene separate into different gametes in equal numbers.
-
The combining of a female gamete and a male gamete at fertilisation occurs at random.
The conclusions we have drawn from the breeding experiment in maize are the same as those drawn by Mendel and apply to all sexually reproducing eukaryotes, including humans. The main features of the experiment that we have described so far, and that can be explained by the theory of inheritance, are summarised in Table 1.
| 1 | The phenotype of pure-breeding varieties for a particular character is constant when crossed with members of the same variety. |
| 2 | One parental character disappears in the F1 generation when parents differ in the character for which each is pure-breeding (the recessive character is masked by the dominant character). |
| 3 | The outcome of a cross is independent of which parent provides the ovules and which the pollen. |
| 4 | The vanished (recessive) character reappears in about one-quarter of the F2 generation. |
| 5 | The two copies of a gene segregate to different gametes at meiosis and in equal numbers. |
| 6 | Gametes combine at random at fertilisation. |
Activity 5
In what respect does each of the following hypothetical breeding experiments produce results that differ in an important way from the results described in the breeding experiment in maize? Note down in each case how the results differ.
Experiment 1 100 pure-breeding red-flowered plants are crossed with 100 pure-breeding white-flowered plants. All of the offspring have red flowers. These offspring are then crossed with each other. About three-quarters of their offspring have white flowers, and about one-quarter have red flowers.
Experiment 2 100 pure-breeding red-flowered plants are crossed with 100 pure-breeding white-flowered plants. All of the offspring have pink flowers.
Experiment 3 When the pollen from 100 pure-breeding red-flowered plants fertilises the ovules of 100 pure-breeding white-flowered plants, all of the offspring have white flowers. When the pollen from 100 pure-breeding white-flowered plants fertilises the ovules of 100 pure-breeding red-flowered plants, all of the offspring have red flowers.
Answer
The results of Experiment 1 differ from those we have described for maize because in this experiment the character that vanishes in the first offspring generation is the one that reappears in about three-quarters of the individuals in the second generation. This is the other way round from the results in the maize breeding experiments, where it was the character that persisted in the F1 generation that appeared in about three-quarters of the F2 generation.
The results of Experiment 2 differ from the maize results because the colour of the first generation of offspring is intermediate between those of the parents. In the corresponding maize cross, one parental character persisted and the other vanished. {This outcome is possible in some situations; it is described as incomplete dominance}
The results of Experiment 3 contrast with those for maize in that the outcome was different depending upon which plant provided the ovules and which the pollen. With maize, the outcome of the breeding experiment was the same, irrespective of which parental phenotypes provided the ovules and which provided the pollen.