

1 Preamble
I have assumed that you have come to this course because you are interested in the use of models as part of a systems or systemic approach to some situation. This means that I expect certain things of you:
You to have an interest in understanding and interacting with some situation which you find puzzling, intriguing, worrying or which you are trying to manage.
You believe the situation involves more than just a single process like the manufacture of a product such as concrete, or a cake, where the properties of the product can be altered in a predictable way by changing the ingredients or the processing used. It is likely to be a situation in which there is more than one person involved and where the result of any action cannot simply be predicted by common sense, or by a simple mathematical manipulation of a few numbers.
You are already using, or want to learn how to use, some systems-based approach to working with the situation in which you are interested.
You are aware of how a systems approach differs from other approaches commonly used in scientific analysis, sociology or business management.
In order to get the most out of this course, you need to be familiar with, or at least not worried by, simple mathematics, and recognise some related concepts such as chance and probability. Working through the first self-assessment question (SAQ) will give you an indication of the skills and attitudes involved. If you find you are having a lot of difficulty with SAQ 1, put this course aside and select a more appropriate course from the topic list.
SAQ 1
-
Define what you understand by a system.
-
Describe why you are interested in studying Systems, as opposed to physics, chemistry, engineering or a social science.
-
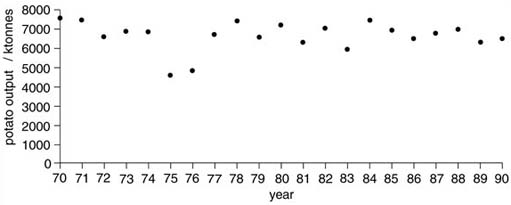
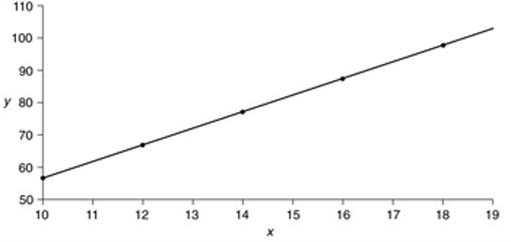
Describe in words what the graphs in figures 1 and 2 below tell you, and comment on any features of the way that they are drawn, which you think are important.
-
What does rate of change mean?
-
Describe in words the following:
y = 24x 2 + 2x - 3
-
Calculate
Answer
-
For the purposes of this course the definition used has four parts:
-
A system is an assembly of components, connected together in an organised way.
-
The components are affected by being in the system, and are changed if they leave it.
-
The assembly of components does something.
-
The assembly has been identified by someone as being of interest.
-
-
Obviously, I cannot provide an answer which describes your particular reasons, but I would expect you to mention things such as an interest in complicated situations, a recognition that many of the phenomena with which we have to deal regularly cannot be explained on the basis of simple causes and effects and a recognition that peoples’ perceptions of situations will often be different. None of these is explicitly recognised by the conventional sciences such as physics or chemistry. Engineers have to deal with complicated situations, but generally do not concern themselves with human perceptions of situations. Social scientists are usually more concerned with analysis than with taking action, which is usually one aspect of systems work.
-
(a) Figure 1 is a graph of the output of potatoes, with one value plotted for each of the years '70–'90. In this case, it was 1970 to 1990, although you could not be sure of this from the graph. The output is given in kilotonnes (ktonnes), that is thousands of tonnes. The overall impression is that the output varies about a value of 7 million tonnes, although in two cases, 1975 and 1976, the values are much lower. (The data are actually for the UK, and 1975 and 1976 were years of low rainfall, when potato crops were badly affected.)
(b) Figure 2 is a much simpler looking graph, which shows that something (y) increases as the quantity on the horizontal (x) axis increases. The graph is a straight line, so that formally, we can say that x and y are linearly related. In this case, they are related by the equation y = 5x + 7. There are some interesting contrasts between the two graphs, apart from the obvious ones of shape. The potato data are plotted with the whole scale from 0 to 7000 shown on the vertical, left-hand axis. This is usually the better way to plot such data, although you will see that Figure 2 is plotted so that the vertical axis only runs from just below the lowest value (57) to just above the highest (107). This tends to exaggerate the changes that occur, and could be misleading in certain circumstances. Note also that in Figure 3, the individual points are joined up, whereas in Figure 1, they are not. The reason for this is that in Figure 2, there is a corresponding value for y for any and every value of x. Potatoes are harvested over a relatively short period, so the data presented in Figure 1 are the total for a given year. Joining up the points would be misleading, since it would imply that there is a value for year 73.5, which is clearly nonsense. It might be better to plot Figure 1 as a bar chart.
-
Rate of change refers to the amount by which something changes per unit of something else. Usually, it is per unit of time. So, a familiar example is acceleration, which is the rate of change of speed. Consider, for example, a car which accelerates from 50 km/h to 100 km/h in 10 seconds. This changes its speed by 50 km/h, so its rate of change (its acceleration) is 10 km/h per second. In looking at any system that changes with time, the rate of change is often as important as the absolute amount of change.
-
This is another equation, which formally states the relationship between two items each of which can take a range of numerical values. These two items are formally called variables, and are represented by the italicised y and x. The variable y is called the dependent variable, which is related to the independent variable x in such a way that the value of y is 24 times the value of x squared, plus 2 times the value of x minus 3.
The 24 in this equation is called the coefficient, or multiplier of x, and the 3 is another coefficient, this time a constant.
-
This expression requires you to multiply 1.3 by 25, and to divide the result by 100 (102 is 10 squared, or 10 × 10). The answer is 0.325.