

3.10 Adding noise
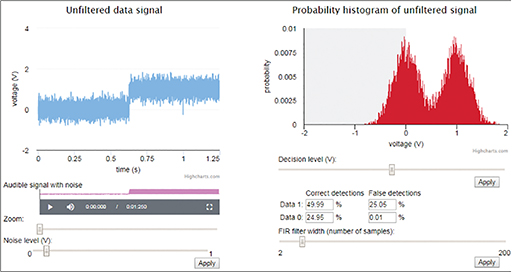
After familiarising yourself with the interface in Interactive 1, try adding noise in the top left zone. The Noise level (V) slider is not calibrated, except for having a minimum value of 0 and a maximum of 1. Judging by eye, set the slider to around 0.1 V and click on Apply. You can hear what the noisy signal sounds like by going to Audible signal with noise and clicking on the Play (triangle) icon. The top part of the interface should resemble Figure 33.
Activity 9
Why has the display in the top right zone changed? What is the display now showing?
Answer
The effect of the added noise is to change the voltages representing 0 and 1 randomly around the mean values of 0 and 1. The display shows a histogram of the probabilities of particular signal voltages. Voltages close to the mean are most likely, so the histogram has peaks at 0 and 1; voltages further away are possible, but less likely the further you go from the mean values.
Next you will look at changing the decision level.