

Communicating risk
In general, risk comparisons can help people to comprehend probabilities or magnitudes. Most people find it hard to relate low-risk probabilities or proportions, such as ‘one in a million’, to their everyday experience. It can help to communicate risk by making quantitative comparisons between familiar and less familiar risks. For example, the risk of a UK nuclear power station undergoing a radiation release that kills 100 people is similar to the risk of dying as a result of cycling 10 miles on UK roads. An even better approach can be to use analogies: one in a million is approximately equivalent to 30 seconds in a year, 1 drop of liquid in 70 litres, or 1 centimetre in 6.4 miles/10.3 kilometres. Another solution might be to express risk in terms of the number of persons who might be affected per year or per hypothetical 70-year lifetime.
Even more difficult to communicate is the fact that a one-in-a-million risk estimate is not an estimate of actual risk, but an upper bound on the likelihood of a risk. That is, the actual risk is likely to be much lower, and it could be zero, but it is quite unlikely to be higher.
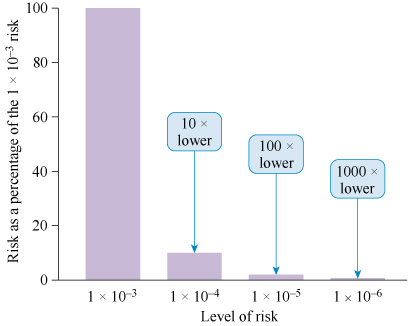
In communicating risk, it is important to ensure that the audience appreciates the logarithmic nature of risks expressed in terms of powers of 10. This is shown in Figure 12. Starting with a baseline risk of 1 in 1000 (or 1 × 10⁻³), this is shown in the first column and is allocated 100%. Reducing the risk by a single order of magnitude to 1 in 10 000 (1 × 10⁻⁴), gives a reduction in risk of 90% represented by the second column in Figure 12 which stands at 10%. A second reduction of one order of magnitude from 1 in 10 000 (1 × 10⁻⁴) to 1 in 100 000 (1 × 10⁻⁵), gives a reduction that is one-tenth of the first reduction – thus reducing the original risk to 100 - 90 - 9 = 1 as shown in the third column of Figure 12. A further reduction results in a (probably) insignificant reduction in the overall risk.
The scientific community has a very important role to play in measuring risks and in presenting this information in as clear a manner as possible, with appropriate cautions about uncertainty. It is then a responsibility of society as a whole, with no particular group having a more privileged position by right, to determine what is tolerable and acceptable based on social, political, cultural and even economic considerations. Clearly, there are areas where the risk is so high as to be manifestly unacceptable, and others where it is so low as to be negligible. Of course, most debate is in the grey area in between. Legislation, attitude and hence behavioural change are important channels for reducing risk. Many hazards cannot be abolished in the sense that they are completely eliminated. Therefore, reducing risk is often a question of reducing exposure.
In the UK, the logic for reducing occupational risks to health is to achieve a situation whereby exposure is controlled to a level to which nearly all the population could be exposed day after day, without adverse effects on health. An important test of any engineering (or other) system is whether the community affected will regard a risk as being acceptable to them. Only under these conditions can it be said that something with low risk levels is also safe.