
5 Phase
5.1 Phase and phase difference
In this section I am considering sine waves that have the same frequency, but are out of step with each other.
Suppose we have two detectors at fixed points, A and B. At this moment in time A is in a high pressure region and B in a low pressure region. If we were to look again shortly later B would now in a high pressure region and A in a low pressure region. The pressures at A and B would be out of step with each other. The pressure variation at B is not in phase with that at A. The exception is when A and B are an exact number of wavelengths apart, in this case the pressure variations at A and B are in phase.
Figure 13 shows how the pressure varies with time near the tuning fork (Figure 13 (a)) and at a distance (Figure 13(b)).
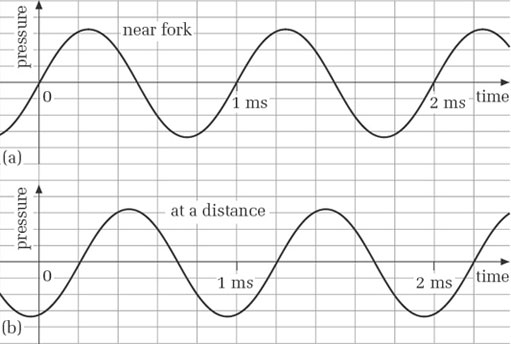
Although the two graphs have the same frequency, they are not in step. At any given moment, each is at a different part of its cycle. For example, if you look at the 1 ms point on each graph you can see that the curves are at different parts of a cycle.
We use the word phase to refer to the part of a cycle that a particular vibrating system is in at any moment. In practice we are often less concerned with the phase of a single wave than with the phase difference between two (or more) waves having the same frequency. (The stipulation ‘having the same frequency’ is necessary because we cannot really speak of a fixed phase difference between sine waves with different frequencies.) Another way of saying that there is a phase difference between two sine waves is to say that they are out of phase. When the waves have the same phase, they are said to be in phase.
In Figure 13, on each graph's horizontal axis events to the right are happening later than events to the left. Thus, because the first peak in (b) is to the right of the first peak in (a), we say that the pressure variations in (b) are lagging in phase behind those in (a). Alternatively, we can say that the pressure variations in (a) are leading in phase those in (b).
Activity 17 (Self-Assessment)
Answer
The delay is 0.2 ms.
One way to answer the question would be to look at where the first peak occurs in each graph and to try to read the time difference. This is not easy because neither peak occurs on a grid line, and finding the exact summit of a smoothly curving sine wave is not easy. In cases like this it makes more sense to compare the points where the graphs cross the horizontal axis at the end of corresponding cycles. In Figure 13(a) the end of the first cycle occurs at 1 ms. In Figure 13(b) the end of the corresponding cycle occurs at the next vertical grid line after 1 ms. As there are five grid lines between 1 ms and 2 ms, the space between each pair of adjacent lines represents 0.2 ms. Hence there is a delay of 0.2 ms.
In the last activity there was a phase difference of 0.2 ms, but phase differences are not always expressed in units of time. Instead, a phase difference is commonly expressed quantitatively in one of the following two ways:
(a) as a fraction of a cycle
(b) as an angle.
The first of these is fairly straightforward, as the following activity demonstrates.
Activity 18 (Self-Assessment)
In Figure 13, by what fraction of a cycle does (b) lag (a)?
Answer
The phase difference is 0.2 millisecond, and the period is 1 millisecond, so the phase lag is 0.2 of a cycle, or one-fifth of a cycle.
Expressing a phase difference as an angle depends on the fact that in a periodic wave, every cycle is identical to every other, and we can regard one cycle as being like a complete rotation round a circle: 360 degrees. After one cycle, we are back at the part of the cycle where we began. After half a cycle we are halfway to the part of the cycle where we began.
The phase difference in Figure 13 was calculated in Activity 17 to be a fifth of a cycle. To express this as a phase difference in degrees we simply calculate a fifth of 360 degrees, because one cycle corresponds to 360 degrees. The answer is 72 degrees.
If the phase lag were increased continuously beyond 72 degrees, it would eventually reach 360 degrees, which would bring the two sine waves back into phase again. If the phase difference continued to increase, the waves would next be in phase at 720 degrees, and so on.