

5.9 Mechanical tests by David Kirkaldy
In order to determine which of the several parts of the joint were weakest, and gain some idea of the scatter in strength, David Kirkaldy was employed by Henry Law to test various samples he had collected from the bases of the fallen piers. David Kirkaldy had a good reputation for accurate and rigorous mechanical testing of materials using a large tensometer he had designed and built in London (see Input 9, linked below).
Click 'View document' below to open Input 9
View document [Tip: hold Ctrl and click a link to open it in a new tab. (Hide tip)]
Kirkaldy first tested several complete joints using intact samples salvaged from the piers by Henry Law. As there were two types of lug present on each column, he tested both top lugs (double lug designed to secure both a diagonal and horizontal bar) and bottom lugs (single lug to secure a diagonal bar). They would be tensioned in the final structure, and this was the basis of their reinforcing action in the piers, so he tested them in simple tension. The experimental set-up and results are shown in Paper 2 on page 1x, linked below. The strut joint was not tested.
Click 'View document' below to open Paper 2, page 1x (1 page, 579 KB).
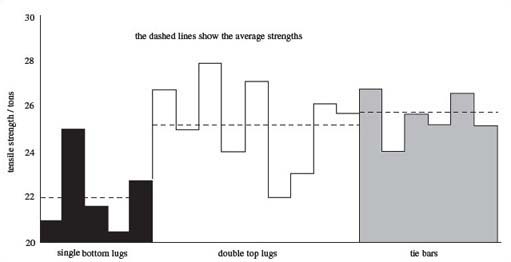
So what were the results? They are shown in histogram form in Figure 46; it shows in sequence from left to right, bottom lugs, top lugs, and tie bars (tested separately, as shown on pages 1ix and 1xii of Paper 2, linked below). Although one of the bottom lugs was quite strong, the rest proved to be weak when compared both with the top lugs and the wrought iron bars alone. The mean values calculated from Kirkaldy's results are as follows:
Click 'View document' below to open Paper 2, pages 1ix and 1xii (2 pages, 976 KB).
The scatter in values was also very large for the lugs, but much smaller for the bars (Figure 46). The results confirmed the visual evidence from the piers, both standing and fallen: bottom lugs had failed preferentially to the top lugs or bars when tensioned.
David Kirkaldy went on to test the strength of bolts in tension, samples of cast-iron cut from columns and the girder iron.
Question 13
Examine the mechanical tests of the various components of the piers by David Kirkaldy, especially the results for the cast-iron samples machined from the columns. Using the average tensile strength of the cast iron, estimate the average fracture strength of a bottom lug. Account for any discrepancy you may find with results for bottom lugs tested directly. What factor in the movement of the piers could affect the strength of the single lugs?
Answer
Looking at the results (Paper 2, page 1xiii of report) shows most of the cast-iron tension tests were sound. This probably means there were no gross internal defects – such as blow holes – which could affect the strength of the samples. For the 14 tensile samples tested with a ‘pulling stress’:

The strength in compression (‘thrusting stress’) was much higher.

This confirmed that the cast-iron samples were much stronger in compression than in tension.
To calculate the fracture strength of a single lug, we need to estimate the area over which the load was applied. As the majority of fractures occurred across the lug from the centre of the bolt hole, the area exposed in such a fracture can be used to estimate the area over which the load is applied. Using the known dimensions of the single lug shown in Figure 16, the area is just twice that, because there are actually two lugs per single joint to the tie bar.
The total length of joint can be estimated by drawing a line across the centre of the bolthole to meet the curved exterior surface of the lug, using Figure 16 at the appropriate scale. The tie bar is 4.5 inches wide and the distance across the lug is about the same length – as an upper estimate. Each lug is 1 inch in wall thickness, so the total area is about 4.5 inch2. Given the bolt holes are 1.25 inches in diameter, the net area of a single lug exposed to load from the tie bar is

The actual area exposed to load will be twice this value because there are two lugs per joint, giving

As the tensile strength of the cast-iron of the columns is about 9.1 tonf inch−2 the nominal load at break is

Now the average breaking load of a bottom lug when measured directly by Kirkaldy was about 22 tonf, a much lower figure than the above estimate. The load has been decreased by a substantial factor given by:

The discrepancy is caused by the stress concentration effect of a round hole. Although the nominal stress in the lugs at fracture was only about 22 / 6.5 = 3.4 tonf inch−2 in the tests, a stress concentration factor of about 3 at the edge of the hole will give the total stress of 3 × 3.4 = 10.2 tonf inch−2. This is greater than the tensile strength of the cast-iron, so fracture will initiate at the edge of the hole and progress across the lug.
In addition, the boltholes were actually conical in shape, so yet another concentrating effect may have been present at the contact zone between the bolt and lughole.
Oscillating stress could create fatigue cracks in the section, lowering the breaking strength substantially.
So the tests showed the lugs to be substantially weaker than expected owing to the stress concentrating effects of round tapered bolt holes. There was also substantial scatter in the results, especially for the cast-iron samples. Unfortunately, Kirkaldy was not called to give evidence before the enquiry, for there were several issues relating to the tests he could have clarified. Instead, his results were presented to the enquiry by Henry Law.
There was some confusion over interpretation of the results Kirkaldy could have explained. However, the weakness of the bottom lugs was clear. Unfortunately, he did not apparently record the exact nature of the fracture surfaces, which would have been valuable for modern analysis. The actual samples may have been preserved in his Museum of Fractures, but they were apparently removed in 1940 to help the war effort.
Years later, when his autobiography was published, some of the problems of analysis of the bridge samples were explained. A problem faced by all who test samples from accidents is whether or not they are representative of those that failed.
Because they were retrieved intact, it could be argued that they possessed a greater strength than those that failed. In other words, there is a bias solely due to survival. A larger number of samples tested might have clarified the issue. Nevertheless, the actual test strengths could be optimistic estimates of the strength of those that actually failed.
When a complex structure is stressed to criticality, it is the weakest parts that inevitably fail first, so the stress concentration effect may have been larger than predicted from the tests, for whatever specific reason such as poor fitment of the bolts in their holes and the conical hole section produced by the Wormit foundry.
There is one final point that bears directly on the disaster. The low strength of the cast lugs would have been evident if the parts had been tested by Kirkaldy before, rather than after the disaster. However, he never performed such vital tests during either the design or construction phase of the bridge – as was made clear in his biography. He tested the wrought iron during the design phase but nothing else.
Further tests to assess the effects of vibration on the joint or lugs were never performed at any stage, although Wöhler in Germany had designed test apparatus to perform such tests on railway wagon axles and reported on his results in the 1860s. A summary had also been published in English in Engineering magazine in 1867. Nowadays, such tests would be performed routinely as part of the contractual agreement between the parties involved in such a major project.
Question 14
Using the elongations measured by Kirkaldy for the diagonal bracing, estimate the lateral movement in any tier of the bridge needed to produce failure of the tie bar. Use Figure 43 of Question 10 for your calculation. What would the lateral movement of the top of the pier be if all the east-west tie bars were on the point of failure?
Answer
The results shown on page 1x of Paper 2 are the most directly relevant to the performance of the tie bars on the bridge. The ultimate extensions for the five bottom lugs broken in the tests were as follows:
The variation reflects the variation in total fracture load for the five samples, although the correlation between each set is rather poor. The first sample broke at the relatively light load of 46 888 lbf with a high extension of 0.976 inches, but yet the third sample broke at a higher load of 48 292 lbf with a considerably smaller extension of only 0.568 inches. In a test of several components, the weakest part will break first, and the comments provided in the final column show that a bolt fractured as well, presumably at the same time as the lugs.
So the average extension of a tie bar is about 0.74 inches before the lug fractures. Each east-west tie bar is set diagonal within the tier it reinforces, shown at the top of Figure 43 in a tier at equilibrium.
From Figure 43, the sideways movement t is given by

For a seven-tiered pier, the total average lateral movement at the top of the pier is about 7 × 1.05 inches = 7.35 inches.
Clearly, however, the possible range of movement could have been greater if the backlash in the joints is added to the estimate. This might give an average sway of up to 7.5 + 7.35 ≈ 15 inches.