

MP3 continued
The last activity showed that sub-band 3 is not, in this instance, masked by the loud sound in sub-band 4. However, the raising of the threshold by 20 dB means that for encoding purposes sub-band 3’s output level is reduced. Specifically, as the output level of sub-band 3 exceeds the threshold by (42 – 20) dB, the effective level that needs to be encoded is only 22 dB. In the VBR encoding used in MP3, 1 bit is allocated per 6 dB of level above the threshold. This means that sub-band 3, which exceeds the threshold by 22 dB needs an allocation of 4 bits to encode this sample. An allocation of 3 bits would be insufficient as 3 × 6 dB = 18 dB, which is below the level of 22 dB, whereas 4 × 6 dB = 24 dB, which is above 22 dB.
The procedure outlined here has to be carried out across all sub-bands where there is frequency masking from other sub-bands. The effect of temporal masking also has to be taken into account. These processes have to be repeated to cover the entire duration of the recording.
MP3 achieves high-quality audio reproduction at 128 kbit s−1. This contrasts markedly with the CD bit rate of 1.4112 Mbit s−1. MP3 generally achieves 10:1 compression without introducing notable subjective effects into the reconstructed sound. Incidentally, it is common to refer to compressed audio files in terms of a bit rate in kbit s−1 or Mbit s−1 rather than as an actual file size. The reason for this convention is that MP3 and other audio formats are extensively used in streaming applications where the emphasis is on throughput and quality of service (QoS) rather than storage capacity.
The majority of MP3 recordings are made at 128 kbit s−1, which provides sufficient audio quality that the majority of people (apart from hi-fi buffs) would not notice the difference. As the bit rate drops to 64 kbit s−1, however, the loss becomes much more perceptible at the top (treble) end. The bass response also tends to degrade, and higher frequencies take on a distinctly artificial digital tone. The reason for this is that the MP3 developers decided to limit the audio bandwidth to approximately 16 kHz for 128 kbit s−1 and only approximately 8 kHz for 64 kbit s−1.
Activity 3.4 Exploratory
This activity: ‘Perceptual sensitivity and masking’ allows you to explore some audio examples of the relative hearing sensitivity response of the ear, as well as frequency and temporal perceptual masking effects.
Frequency masking
To demonstrate frequency masking, you will hear a relatively loud sine-wave tone (440 Hz) masking a quieter tone at a different frequency (652 Hz). The image below provides a visual representation of the audio clip: the horizontal direction represents time, the vertical direction represents amplitude, and the green shapes are the envelopes of the sine-wave tones. The sine waves are too closely packed for their cycles to be visible. You will probably find it helpful to look at this image while you play the audio clip.
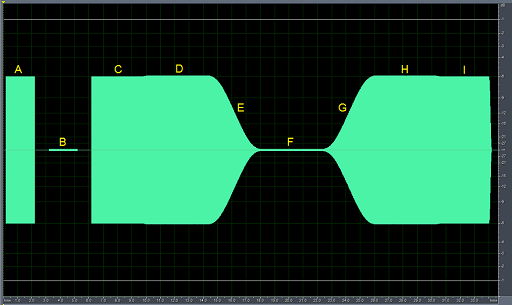
The first two sounds in the clip are simply to familiarise you with the masking tone (440 Hz, shown in the figure at A) and quieter masked tone (652 Hz, shown at B). You will hear 2 seconds of each.
The masking demonstration follows. There are 4 seconds of the 440 Hz masking tone (C). The quieter 652 Hz tone is then added, and the two tones are played for 4 seconds (D). When you play the audio clip, try to identify whether you can hear the 652 Hz tone during this part.
The 440 Hz masking tone then fades out (E), leaving just the 652 Hz tone for 4 seconds (F). Finally, the 440 Hz masking tone gradually fades back in (G) and should eventually mask the 652 Hz tone (H). The audio clip ends with 4 seconds of just the 440 Hz tone again (I).
Play the audio clip now.
Temporal masking
In temporal masking, a loud sound makes a closely following sound inaudible. The effect is most noticeable when the following sound is relatively quiet, and when it follows after a very short gap. The image below shows the sequence of sounds used in each of the demonstration audio clips.

In each of the four audio clips below, a relatively long, large-amplitude 632 Hz tone is followed by a gap, and then a quieter version of the same tone.
In the first clip, the gap between the two tones is fairly long (60 ms). The tone after the gap is audible as a very short blip (like a faint echo) after the main tone.
In successive clips, the gap gets shorter. You should find that the final blip becomes inaudible as the gap decreases to 10 ms.