
2.3 Starting a field study
When you go to somewhere that is new to you, and of which you know very little, you should have a plan of action to help you to put together a scientific description of the site. Fairly obviously, one of the things you would do is to note the location and make a description of what you are able to see. This might be in the form of a sketch map. It might also include producing a species list of the plants and animals found in the site. However, to make a complete species list might take days, weeks or even years, depending on the size of the site. One way round this is to make a list of the most common or dominant species. With time you might add the names of less common, yet fairly frequent species. With even more searching, the species that are only occasional can be added. In doing this you would be making subjective judgements, i.e. judgements that are qualitative and do not require the collection of quantitative information. But subjective assessments can be misleading. For instance, you might be influenced by the ‘attractiveness’ of a species, the prominence of its location or simply through bias, that is finding what you think you ought to find. In the long run, as a field scientist, it is important to collect quantitative data that ensure an unbiased assessment and description of the location. It is also often important to be able to describe a site over a relatively short time-scale.
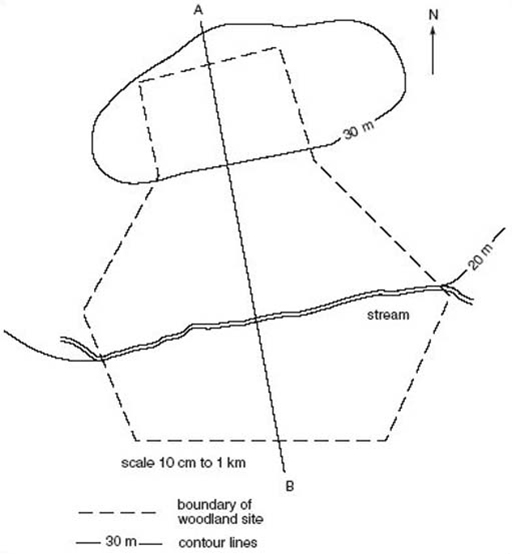
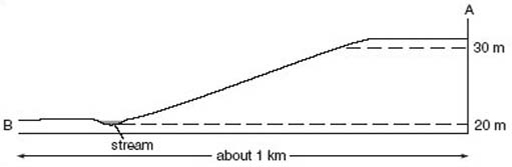
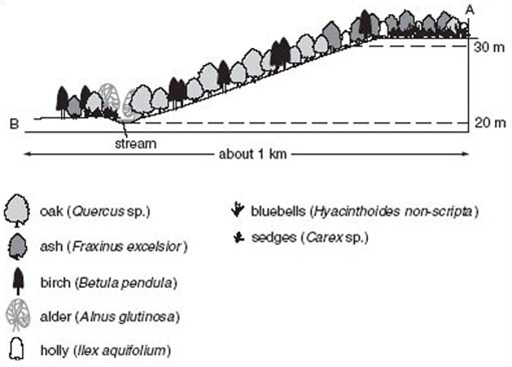
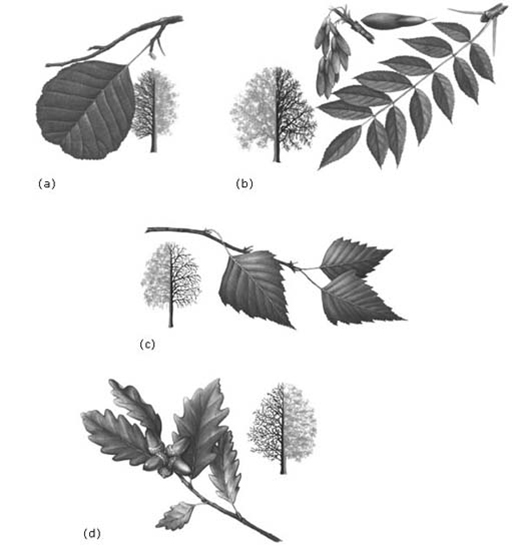
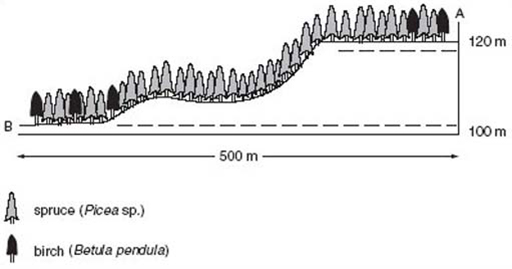
Figure 25 is a sketch map of a deciduous woodland site. Figure 26 is a profile of the site showing its topography along the line marked A to B. You can see that part of the wood is on top of a small hill, part is on a slope and part is on a flatter area at the bottom of the slope. A small stream runs along the base of the slope. Is the woodland a uniform habitat? One way of testing this out is to walk along the line A to B (technically this would be called a transect), noting whether the tree species that you see are the same throughout. Let us assume for the moment that they fall into three groups (Figure 27). Ashes and oaks (Figure 28b and d) dominate on the flat land at the top of the hill, oaks and birches (Figure 28c) dominate on the slope, and alders (Figure 28a) and birches along the narrow stream-side strip and on the flat area beyond. If these three areas really are distinct, it would be safe to survey each of them as if they were separate habitats. But to ensure that there was no bias in your data collection, your three areas should be sampled randomly. If the changes between the top and bottom of the hill are gradual, in other words if it is not easy to see where one habitat ends and another begins, then you need to sample at intervals right along the transect.
Woodland is usually a multi-layered (i.e. three-dimensional) habitat, with tall trees forming the tree layer, small trees forming the understorey and low-growing shrubs and herbaceous plants forming the ground layer. Figure 27 is a profile of these three layers along the transect A–B. The key tells you that, at the top of the hill, the understorey includes holly (Ilex aquifolium); however, this species does not occur on the slope or at the foot of the hill. Similarly, the ground layer at the top of the hill is thick with bluebells (Hyacinthoides non-scripta) in spring but these do not occur on the slope or at the foot of the hill. Near the stream there are big clumps of one of the tall grass-like sedges (Carex spp.). From plant distributions in either the tree or the ground layer it is reasonable to propose that the three sections of the profile are different. If you think you can differentiate between areas, it is reasonable to think they may be different habitats and therefore they should be described individually. You can, however, provide better evidence of this by collecting quantitative data.
Question 9
Figure 29 is a profile of the vegetation in a spruce plantation. (a) Describe how the vegetation (other than the trees themselves) differs from the profile of deciduous woodland (Figure 27). (b) How could you account for the differences?
Answer
(a) There are no understorey or ground layers.
(b) One possibility is that the tree canopy is so dense throughout the year in the spruce plantation that hardly any light penetrates to the ground layer, whereas there are times of the year when light can penetrate through the tree canopy in deciduous woodland.
Most habitats are three-dimensional to some extent, although the scale may not be as noticeable as it is in deciduous woodland. Garden lawns, for instance, may well have a close ground-hugging moss layer under the grass and this can become dominant, to the annoyance of the lawn-keeper, if the soil becomes compacted and hence poorly aerated.